1
$\begingroup$

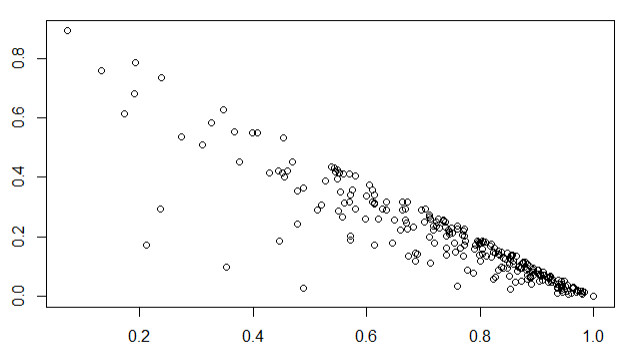
I'm looking at correlation for a large number of vectors, and many (about 3000) of these pairwise comparisons appear to have a significant correlation even after Bonferroni correction. Plotting these vectors tells a different story, though. A few look like this:

scatter plot showing a clear negative correlation

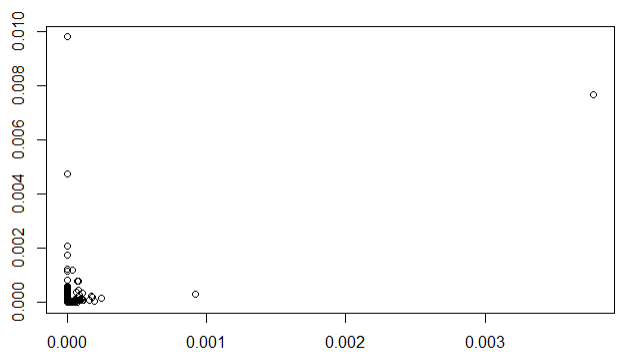
but the vast majority are clearly spurious correlations arising from a few outliers, with plots that look like this:

a cluster of points at the bottom left, with a few scattered outliers along the left edge and top right of the plot

I want to filter down to just the vectors which seem genuinely associated, but it's not realistic to go through 3000 plots. Are there statistics I can calculate for each pair of vectors that will help me distinguish between the first and second cases above?

I thought about doing something with (co)kurtosis, and have been playing around with that a bit, but haven't been able to figure out what to do with it exactly.

$\endgroup$
2
  • $\begingroup$ Leverage for person correlation? Maybe bootstrap, som of the resamples Will miss the outliers... $\endgroup$ Commented Dec 10, 2018 at 6:15
  • 2
    $\begingroup$ In the absence of more information about what these data mean or why you are doing this analysis, it's difficult to provide much guidance. But it is clear that a Spearman correlation coefficient would be both computationally fast (because each coordinate would need to be ordered only once) as well as distinguishing these particular cases. Maybe you could provide more information about your objectives and data characteristics? $\endgroup$
    – whuber
    Commented Dec 10, 2018 at 19:53

1 Answer 1

3
$\begingroup$

There are many ideas.

  1. Maybe leverage in the corresponding linear regression? Problem: There are two possible regressions, $y=\alpha + \beta x +\epsilon$ or $x=\alpha+\beta y + \epsilon$. Turns out that there is no relationship between the leverages in these two models (exercise). Maybe some leverage formula could be made for correlations also? But from this an idea: Leverage has connections with Mahalanobis distance, so

  2. Calculate the Mahalanobis distance for each point using estimated center and covariance matrix. There is one problem: If non-robust estimates are used, these distances might be misleading. This leads to an answer:

  3. Mahalanobis distance based on robust estimates. This is implemented in R, so:

library(mvtnorm)  # First simulate some example data: 
set.seed(7 * 11 * 13) # my open seed
x <- rnorm(100, 10)
y <- rnorm(100,  10)

sigma <- 100*matrix(c( 1.0,   0.98,
                      0.98,  1.0), 2, 2, byrow=TRUE)
XY <- mvtnorm::rmvnorm(5, c(10, 10),  sigma)
XY <- rbind(cbind(x, y), XY)
colnames(XY) <- c("x",  "y")
XY  <-  as.data.frame(XY)

# Then estimating robust center and covariance:

corrob     <- robust::covRob(XY, corr=TRUE)$cov[1, 2]
covrob     <- robust::covRob(XY, corr=FALSE)
Srob     <- covrob$cov
mu       <- covrob$center 

corrob
    [1] -0.1315657
mu
           x        y 
    9.937185 9.916624 

Srob
               x          y
    x  1.4750940 -0.1256779
    y -0.1256779  0.6186042

XYcent <- as.matrix(sweep(XY, 2, mu)) # subtracting robust center
Maha   <-  sqrt( diag(crossprod( t(XYcent),  solve(Srob, t(XYcent)) )) )
with(XY, {plot(x, y, col=ifelse(Maha>5, "red",  "blue"), main="Point cloud",       sub="with large Mahalanobis distance in red")})

Producing the plot:
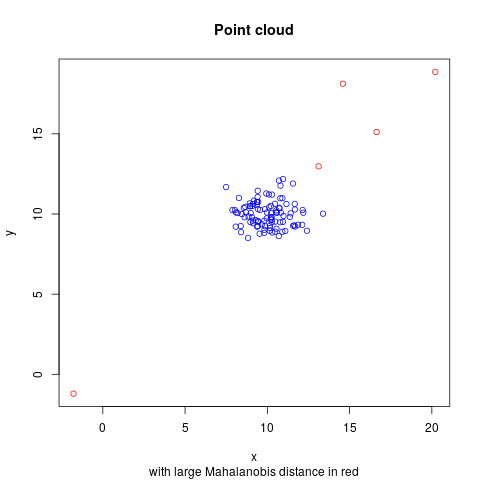
Pointcloud with large Mahalanobis indicated

The cutoff for Mahalanobis distances at 5 was chosen from a histogram of distances (not shown). The covRob function has many options not used, which can be studied in the documentation.

But all that wasn't really necessary, because in the process of robust estimation we did get the robust correlation estimate about $-0.13$, far away from the nonrobust Pearson correlation (try). And the robust package even calculate the distances and make the plot for us:

plot(covrob) #not shown 

which makes two plots (try).

$\endgroup$

Your Answer

By clicking “Post Your Answer”, you agree to our terms of service and acknowledge you have read our privacy policy.

Not the answer you're looking for? Browse other questions tagged or ask your own question.