2
$\begingroup$

Im a programmer who is currently studying to become a data scientist.

I was reading this https://seaborn.pydata.org/tutorial/relational.html#emphasizing-continuity-with-line-plots in this there is a topic 'Aggregation and representing uncertainty'

Can anyone explain what aggregate means in simple English, with an example?

$\endgroup$
5
  • 2
    $\begingroup$ Can you give an example or two? The context is probably relevant. $\endgroup$ Commented Dec 14, 2018 at 4:12
  • $\begingroup$ Aggregation often just means working on a coarser scale, say groups not individuals, larger areas rather than smaller areas, and so on. Examples are aggregating counties to states in the United States. $\endgroup$
    – Nick Cox
    Commented Dec 14, 2018 at 9:49
  • $\begingroup$ I've added the tag terminology and removed descriptive statistics. $\endgroup$
    – Nick Cox
    Commented Dec 14, 2018 at 10:30
  • $\begingroup$ @TheLaconic Turns out you were correct, the context was other than how it read. Answer changed. $\endgroup$
    – Carl
    Commented Dec 14, 2018 at 11:41
  • $\begingroup$ en.wikipedia.org/wiki/Aggregate_data $\endgroup$ Commented Jan 7, 2019 at 17:30

2 Answers 2

1
$\begingroup$

An aggregate is just a clumping together of values according to some aggregation principle(s). For example, there is an aggregate() function in R language. This applies to a time series method or data frame method, and the organizing or aggregating formula might just be addition, or finding a mean value, for example, presidential popularity by year from daily popularity data, or Compute the averages for the variables in 'state.x77', grouped according to the region (Northeast, South, North Central, West) that each state belongs to. In the OP's reference default aggregation appears to refer to finding the mean and confidence intervals of a time series with multiple $y$-values at each time, with another choice being a mean with $\pm$standard deviations. For machine learning, the aggregate is the output of Ensemble learning; "In statistics and machine learning, ensemble methods use multiple learning algorithms to obtain better predictive performance than could be obtained from any of the constituent learning algorithms alone." Aggregation is the method used for forming an aggregate. This usage is seen in the title Ensemble aggregation methods for relocating models of rare events.

Let's put this in more human terms. What ensemble learning methods do is aggregate (to combine 'a vote democratically') from several learning algorithms to make choices. To see why this works, let us construct an example.

One could ask, "Why is the word tribunal in common usage?" To make a long story short, tribunals composed of three adjudicators are more likely (because the best two of three opinions is also the median opinion) to make a best decision than any single judge's opinion would. Also, many people voting for something, is more likely to be constitutionally better than if fewer vote that way.

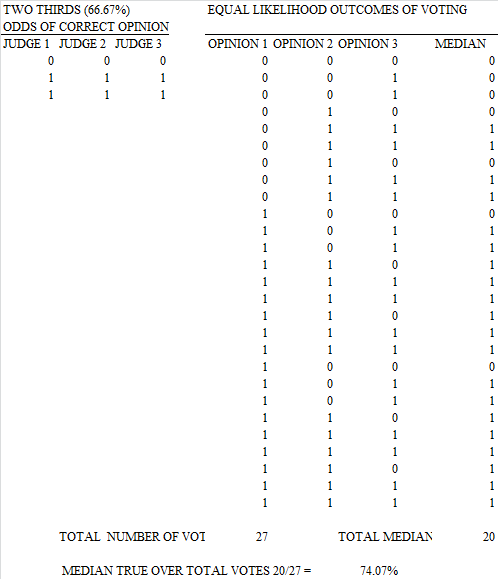
To see the improvement, let us assume that each judge has a 2/3 probability of being correct (a '1') and a 1/3 probability of being wrong (a '0'). Then to see the improvement a tribunal opinion would have for deciding correctly (a '1'), we choose taking the median as the aggregation method, where the aggregate output is the median, and list out all the equal possibilities:
![enter image description here

This shows that the improvement of getting the correct answer has gone from 66.67% (2/3) for odds of correctness for individual judges to 74.07% (20/27) for the median judge's answer. For a more mathematically complete description see "The dirty coins and the three judges" question and answer. Summarizing, as long as the judges have an opinion better than 50-50 (which would be perfect cluelessness), taking the median (an aggregate, or combined value) of three independent opinions (which is what a tribunal supposedly does) will increase the odds of getting the right answer.

In other contexts, aggregates are made when the aggregation increases precision/accuracy and/or to create representative values for subsets (e.g., sort and add).

$\endgroup$
9
  • 3
    $\begingroup$ I didn't read this as a question about ensemble learning... but I also think the question is much too broad. $\endgroup$ Commented Dec 14, 2018 at 4:10
  • 1
    $\begingroup$ @TheLaconic The tags provided imply a context that the question text itself does not. I took the totality of the question to be literally "In statistics and machine learning." $\endgroup$
    – Carl
    Commented Dec 14, 2018 at 4:16
  • 1
    $\begingroup$ I was reading this seaborn.pydata.org/tutorial/… in this there is a topic 'Aggregation and representing uncertainty' $\endgroup$
    – Anko6
    Commented Dec 14, 2018 at 5:05
  • $\begingroup$ @Anko6 OK, statistical ensembles are everywhere. Many people have seen them on TV, for example, Hurricane Track Prediction Using a Statistical Ensemble of Numerical Models $\endgroup$
    – Carl
    Commented Dec 14, 2018 at 5:24
  • $\begingroup$ @TheLaconic Well, I did leave out the term 'aggregation' entirely, corrected now. Maybe that helps the clarity a bit. $\endgroup$
    – Carl
    Commented Dec 14, 2018 at 5:45
1
$\begingroup$

https://en.wikipedia.org/wiki/Aggregate_data

In statistics, aggregate data are data combined from several measurements. When data are aggregated, groups of observations are replaced with summary statistics based on those observations.

In your link the aggregation is done by:

The default behavior in seaborn is to aggregate the multiple measurements at each x value by plotting the mean and the 95% confidence interval around the mean

Thus

  • the 'aggregate data' is the 'mean' and the '95% confidence interval'
  • which is created from the 'several measurements' at each x value.

aggregation is the process to reduce the many measurements into a few values/statistics.

You can do this aggregation in many different ways, the mean and 95% confidence interval is just one of many options to summarize the several measurements. See also https://en.wikipedia.org/wiki/Summary_statistics

$\endgroup$

Your Answer

By clicking “Post Your Answer”, you agree to our terms of service and acknowledge you have read our privacy policy.

Not the answer you're looking for? Browse other questions tagged or ask your own question.