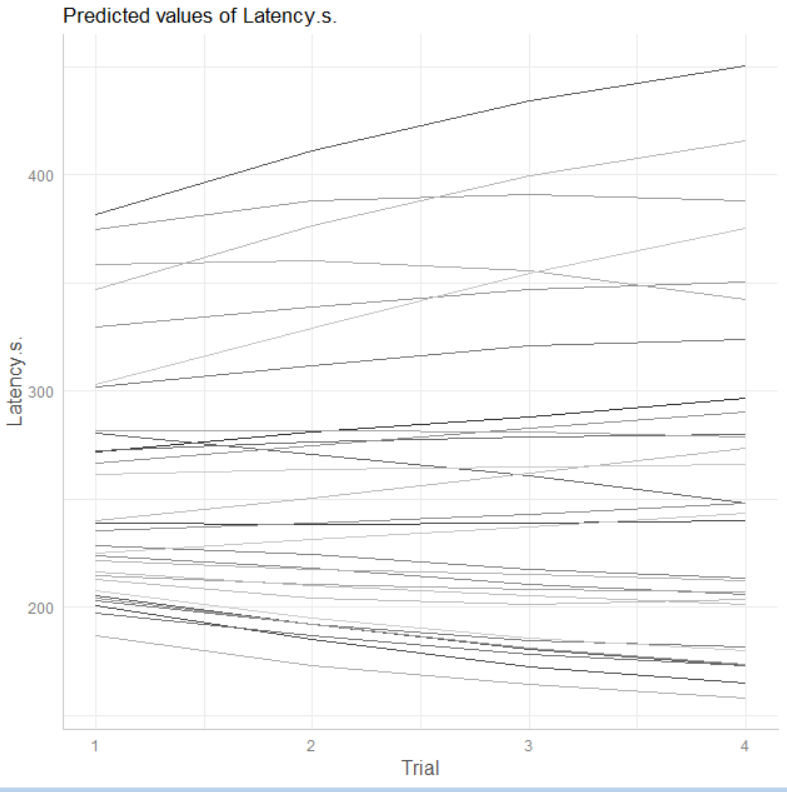
I'm trying to see how boldness of individuals change over time. For this, I constructed a repeated measures random intercept random slope model with boldness scores (measured as latency to resume movement) as the continuous response variable, Trial (time) as fixed effects and Trial|ID as random effects. I used the rstanarm package for this, as lmer resulted in singular fits. Model diagnostics revealed that the model fit was okay. I then used sjPlot package to obtain the random intercept random slope plot (without confidence intervals). Below is the plot.
Each line in the plot represents an individual. As is evident from the figure, some lines are not straight, but rather show slight curvature. According to my knowledge, each line is the line of best fit for individual boldness scores over time. So how can a line of best fit show curvature? Is there something wrong with the model? Examining the model diagnostics showed that the rhat values were close to 1, no divergent transition of iterations and no autocorrelation. I'm also attaching the model fit below.
Any help will be much appreciated. Thanks much in advance!
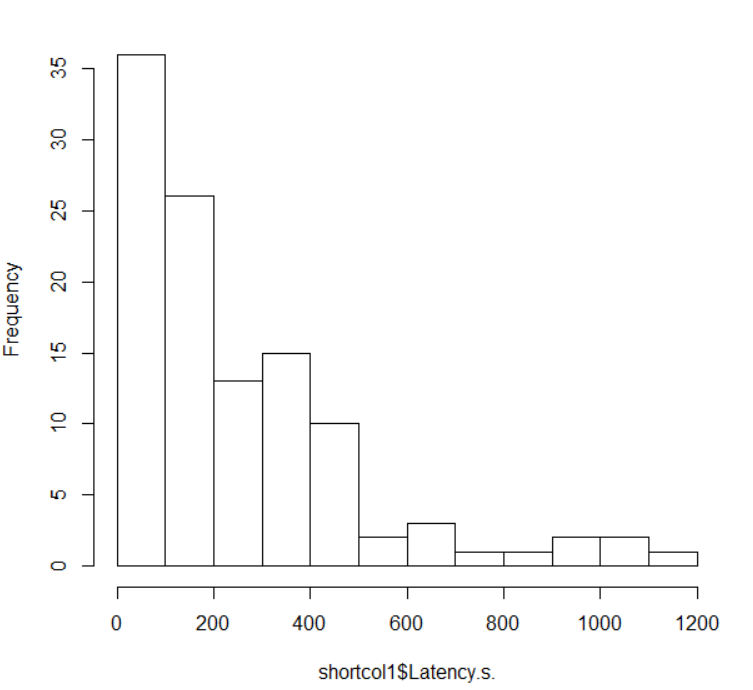
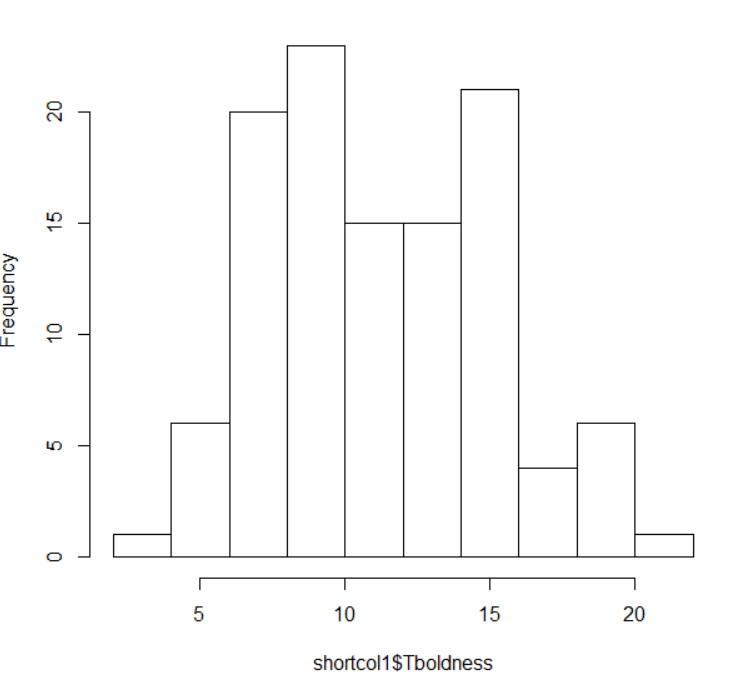
Edit: Model formula is: mod<-stan_lmer(Latency.s.~Trial+(Trial|uniqueID),data=mydata). Trial is an integer from 1 to 4. uniqueID is a factor with 201 levels. The response variable Latency.s. appears multimodal with a left skew, but after Box-Cox transformation still appears multimodal with less skew (0.3). Below are the histograms of the non-transformed and transformed response variable.
 Non-transformed response variable
 Box-Cox Transformed response variable
Adding the summary of the data: Latency.s.: Min=12, max=1114, median=156.5,mean=255.17, 1st quartile=77.75, 3rd quartile=383.25. Trial: min=1, max=4, median=2.5, mean= 2.48, 1st quartile=1.75, 3rd quartile=3.0.
The random slopes plot look similar to the plot attached above even after running the model with the Box-Cox transformed response variable. Reconfirming: variable Trial is definitely not a factor, but an integer.


summary()of your data set; in particular, isTrialnumeric or categorical (factor)? $\endgroup$Trialis definitely not a factor? $\endgroup$