1
$\begingroup$

I'm currently facing a new type of problem, and i have no idea how to solve it, so any suggestion will be really appreciated ! The problem is the following:

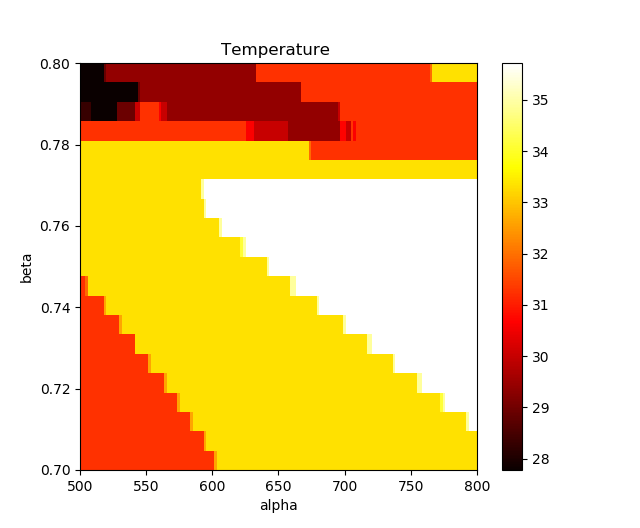
I have a matrix of temperatures, depending on two parameters (Alpha and Beta). We can plot this matrix with matplotlib, and we get :

[enter image description here]

Because we can only observe the temperature in practice, I would like to build a model that estimate the probability distribution of the alpha and beta given a temperature. An example will be : what are the alpha and beta that most likely produce a temperature of 33 degrees ?

Now suppose, we have many measurements of temperature, is it possible to get the probability distribution of alpha and beta given the observed temperatures.

Example : we observed a lot of 28 degrees, we can induce that alpha is probably around 0.8 and alpha around 525. (we can suppose that we can approximate this distribution with a Gaussian for example)

I know that it deals with Bayesian issues, propagation of uncertainty, but i have no idea what type of algorithm i have to use... and how to do in practice.

Any idea ? (it seems to be a quite complicated problem no ? )

Thank you so much !

$\endgroup$
7
  • 2
    $\begingroup$ I suppose you have a matrix that you use for the visualization. You can find the cell in that matrix that is closest to 33C. Would this work? $\endgroup$ Commented Jan 17, 2019 at 21:53
  • $\begingroup$ Hi, thank you for your answer, but as you can see, a lot of cells have the same temperature, it means that is for a single temperature, you have a bunch of possible alpha and beta... the aim is to find their probability distribution... $\endgroup$
    – Tbertin
    Commented Jan 18, 2019 at 15:28
  • $\begingroup$ Just curious:how many experiments or records do you have for one combination of $\alpha$ and $\gamma$? $\endgroup$ Commented Jan 19, 2019 at 7:22
  • $\begingroup$ i have only one estimation per couple $\endgroup$
    – Tbertin
    Commented Jan 19, 2019 at 14:35
  • $\begingroup$ I notice that some people have given an answer in terms of tackling the problem in Bayesian way. Computing some posterior $P(\alpha,\beta | T)$ based on a prior $P (\alpha,\beta)$ and an observed $T$. Is that what you are looking for? $\endgroup$ Commented Jan 23, 2019 at 8:03

4 Answers 4

1
$\begingroup$

It depends upon what you know and the motivation as to why you are doing it. Since you are not concerned with any of the uncertainty about $\alpha$ and $\beta$, we will remove that uncertainty by using the predictive distribution. It would solve $\Pr(\alpha;\beta|\tau).$

Bayesian methods are generative methods, so in the best of all possible worlds you understand how $(\alpha,\beta)\rightarrow\tau.$ In other words, you would know the function that does the mapping. I am going to assume that this is not true. If it is true, then that should be used to create your likelihood function instead of what I am purposing.

The solution will need to distinguish between observed $\alpha$ and the parameters that drive $\alpha$ which will be denoted $\theta_\alpha$ for $\alpha$ and correspondingly, $\theta_\beta$ for $\beta$. In addition, $\theta_\nu$ are any nuisance parameters such as variances.

You are solving $$\Pr(\tilde{\alpha};\tilde{\beta};\tilde{\tau}|\alpha;\beta;\tau)=\int_{\theta_\alpha\in\Theta_\alpha}\int_{\theta_\beta\in\Theta_\beta}\int_{\theta_\nu\in\Theta_\nu}f(\tilde{\alpha};\tilde{\beta}\tilde{\tau}|\theta_\alpha;\theta_\beta;\theta_\nu)\Pr(\theta_\alpha;\theta_\beta;\theta_\nu|\alpha;\beta;\tau)\mathrm{d}\theta_\alpha\mathrm{d}\theta_\beta\mathrm{d}\theta_\nu,$$ in order to use this to get to $$\Pr(\tilde{\alpha};\tilde{\beta}|\tilde{\tau}=T;\alpha;\beta;\tau)$$ to construct your marginal slice of $$(\alpha,\beta)|_{\tau=T}.$$

You will need some version of functional form for $\tau=g(\alpha,\beta)$. Essentially $\tau-\gamma_\alpha\alpha-\gamma_\beta\beta$ which would be a linear regression or whatever would be rational, or, in the alternative, if you have it split into cells rather than as continuous functions, so a local curve on a near manifold. If you do not know the curve structure, then if you have enough data, you could create multiple models and treat the models as an additional parameter. You could then wrap this in $f(\tau,g(\alpha,\beta))$.

$f$ is your likelihood function, $g$ maps the variables deterministically plus a random variable. $f$, if it were a distribution, would be the distribution of that variable. $\Pr(\theta_\alpha;\theta_\beta;\theta_\nu|\alpha;\beta;\tau)$ is your posterior distribution based on $f$ and $g$, which means you will need to create priors, possibly one prior for each cell.

Now as to how to tackle this mechanically. I don't have a good answer. It would likely involve some MCMC algorithm to find the posterior and then probably again to try and map the bivariate prediction for any chosen $\tau$.

Just thinking in terms of the requirements for the software, I don't have an answer because this isn't a trivial problem. If you could divide it into cells so that locally linear relationships are close enough, you could create a normally distributed vector regression as $f$.
$\endgroup$
2
$\begingroup$

You have got a situation where the temperature (a 1D variable) maps to a 2D plane (alpha and beta).

For a single temperature, the alpha and beta can be anything along a single curve.

If you would be able to add something like a secondary variable then you could better estimate which alpha and beta on the curve are most likely. An example could be the distribution of multiple measurements of the temperature. This could give some location information when this distribution is not the same everywhere. But in order to implement this, you would need to have information about the distribution of the error in the measurement (either obtained experimentally or determined based on theoretic considerations).

Several ways that I imagine:The curvature of the iso-lines in the temperature field may relate to the skewness of the distribution of measured temperatures. The slope of the temperature field may relate to the variance of the distribution of measured temperatures. But you will need to know some more in order to design good priors to make a usefull bayesian model that incorporates these effects.


If you want to build a bayesian model with only all information that you currently have, rather then finding ways to extend and improve your data then you have with a maximum a posteriori predictor:

$$f(\alpha,\beta|T)f(T) = f(T|\alpha,\beta)f(\alpha,\beta)$$

and when $f(T|\alpha,\beta)$ is just a delta function (ie. there is no variation in $T$ for a given $\alpha,\beta$) then:

$$f(\alpha,\beta|T) = \frac{f(\alpha,\beta)}{f(T)}$$

which means you end up picking the highest prior probability density for $\alpha$ and $\beta$ on the isoline of the measured temperature.

$\endgroup$
1
$\begingroup$

This sounds a lot like what I once posted. I suggest you take a look at some of the answers already provided there. Here's the link: How to Determine the Underlying Theoretical Distribution for a Sample Data Set

$\endgroup$
2
  • $\begingroup$ Thank you, but i think that my aim is different than yours. I'm not trying a find a distribution for the temperatures, i'm trying to find a distribution for the parameters given a temperature... $\endgroup$
    – Tbertin
    Commented Jan 17, 2019 at 21:32
  • 3
    $\begingroup$ Links are subject to link-rot and so link-only answers are not suitable answers (though links as support for answers are fine). Answers on this site should be able to stand as suitable answers on their own, even if their links were to disappear. Please see the help on answering questions (particularly "Provide context for links"). $\endgroup$
    – Glen_b
    Commented Jan 17, 2019 at 23:55
1
$\begingroup$

I am not sure about this answer but I will give it a try. You can model the posterior probability of parameters $\alpha, \beta$ given your temperature values in the following manner:

$ P(\alpha,\beta|Temperature) = \frac {P(Temperature|\alpha,\beta) \times P(\alpha,\beta)} {\sum P(Temperature|\alpha,\beta) \times P(\alpha,\beta)} $

However, your question relates to computing the prior $P(\alpha,\beta)$. If we assume that $\alpha$ and $\beta$ are independent, $P(\alpha,\beta) = P(\alpha) \times P(\beta)$.

Here is one way you can simulate $P(\alpha)$:

alphas <- rnorm(1000, mean = 0.8, sd = 1) #sample values  for the alpha paramters
pAlpha <- alphas[alphas>0]/sum(alphas[alphas>0])#make sure they are positive and sum to one.

You can do the same procedure for beta then multiply the two probabilities. Then, you need to compute the likelihood $P(Temperature|\alpha,\beta)$ which is $ N ~(\alpha,\beta)$. In here we are assuming that the parameters $\alpha$ and $\beta$, describe the mean and standard deviation, which might be incorrect if you mean that the temperature follows two normal distributions with means $\alpha$ and $\beta$. Finally, you need the evidence which is the sum of the likelihood times the prior. This may be too simplistic, however, it would be more helpful if you can provide more information about $\alpha$ and $\beta$.

$\endgroup$

Your Answer

By clicking “Post Your Answer”, you agree to our terms of service and acknowledge you have read our privacy policy.

Not the answer you're looking for? Browse other questions tagged or ask your own question.