5
$\begingroup$

I have a dataset where I want to predict a continuous variable (Inflow), using binary independent variables, that only take values 0 or 1.

I used a linear model using R. However, my R2 is way too low. Does this mean my model is not good enough to predict the inflow? Are there other methods, preprocessing or models that would help me get a higher R2?

Also could you help me interpret the model results?

Data

   Inflow Friday Language Reality Minage0 Same_year_release
    <int>  <int>    <int>   <int>   <int>             <int>
 1    239      0        0       0       0                 1
 2      6      0        0       0       1                 0
 3     75      0        0       0       0                 0
 4     63      0        0       1       0                 0
 5     35      0        0       0       0                 0
 6      7      0        0       0       1                 0
 7      4      0        0       0       1                 0
 8      1      0        0       0       1                 0
 9     33      0        0       0       0                 0
10    155      0        0       0       0                 0
# ... with 90 more rows

Model

model_lm = lm(formula = Inflow ~ Friday + Language + Reality + Minage0 + 
              Same_year_release, data = inflow_data_tbl)

Model Summary

Residuals:
   Min     1Q Median     3Q    Max 
 -4219   -496     -6    395  80495 

Coefficients:
                  Estimate Std. Error t value Pr(>|t|)    
(Intercept)          23.14     107.01   0.216  0.82885    
Friday              793.41     217.37   3.650  0.00027 ***
Language            595.23     174.88   3.404  0.00068 ***
Reality            2422.87     460.58   5.260 1.62e-07 ***
Minage0            -415.90     141.45  -2.940  0.00332 ** 
Same_year_release   911.92     167.51   5.444 5.96e-08 ***
---
Signif. codes:  0 ‘***’ 0.001 ‘**’ 0.01 ‘*’ 0.05 ‘.’ 0.1 ‘ ’ 1

Residual standard error: 2853 on 1716 degrees of freedom
Multiple R-squared:  0.06046,   Adjusted R-squared:  0.05773 
F-statistic: 22.09 on 5 and 1716 DF,  p-value: < 2.2e-16
$\endgroup$
3
  • $\begingroup$ $R^2$ is highly dependent on your data so you cannot firmly say that this one is too low, although admittedly yours is low. The relationship may not be linear, so you may have to fix that. Other than that, try some other models, if they return similar results the you are proverbially screwed. $\endgroup$ Commented Jan 18, 2019 at 14:43
  • $\begingroup$ @user2974951 thanks. but you have some suggestion what other methods/models can be applied??? $\endgroup$ Commented Jan 18, 2019 at 14:56
  • $\begingroup$ Standard ML methods, random forests is one of the simplest options. Also I saw that you have all categorical independent variables, this likely is partially responsible for the low R2 score. $\endgroup$ Commented Jan 18, 2019 at 15:07

2 Answers 2

2
$\begingroup$

First of all, let's remember that model interpretation is always contextual (depends on your data and what are you trying to achieve).

However, I'll try to explain some general points. You're in a tricky scenario. The low R squared means that your model only explains 7% of the dependent's variation. Nonetheless, the low p-value means that your model fits the data very well, and therefore the probability of your coefficient actually being zero is very low.

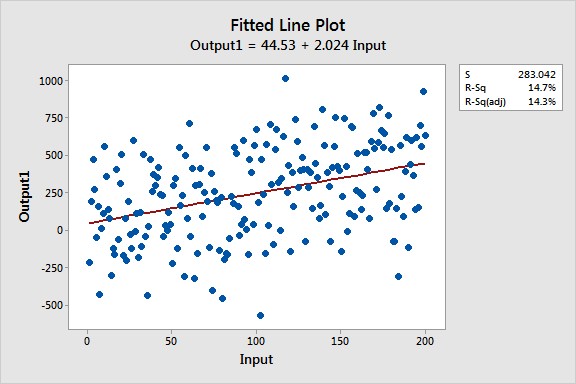
If we plot the regression line and your data points, it would look something like this:

Example of a model with Low R squared and low p-value

Notice how the regression line (in red) accurately predicts the general trend of the data points, i.e., a positive tendency: the higher the independent variable, the higher the dependent value (this is the low p-value). But the data points are not very close from the regression line; they are heavily scattered around it (this is the low R-squared).

Given this information, let's try to interpret your model (since I don't know what your independent variables actually mean, I'll be as general as possible). Take the variable Friday as an example. If your other variables remain constant, a change in Friday (0 to 1) means that there's an average change in Inflow of about 804.4 units. This would be the same if your model has an R squared of 0.99 or a R squared of 0.01. However, if you were to use this model to predict Inflow with new values for your independent variables, your prediction interval will be fairly high. This is the only point where R squared matters in retrieving useful info from your model.

Now, my friend. A low R-squared is not necessarily bad (and they are fairly common in Social Science research). Yes, a model with a higher R squared would be better, but your model fits the data very well and can give you very useful information already on the relationship between your independent variables and your dependent variable.


High R squared values are not inherently good. Your model can account for a high proportion of the dependent's variation, but have coefficients that underestimate or overestimate the data distribution.

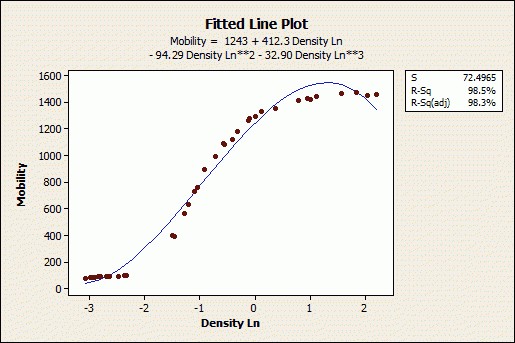
Take a look at this example:

High R squared

Although R squared is 0.985, you can clearly see that the regression is biased (at some points it overestimates, while at others it underestimates).

I'd recommend that to better assess your model, you should plot the fitted values vs the observed values. You can also plot the standardized residuals, to better visualize what you're dealing with.

Also, to improve your model (not necessarily your R squared), keep in mind that your dependent variable may be affected by other factors that are not currently in your model. Also you can try some form of factorial ANOVA.

$\endgroup$
2
  • 2
    $\begingroup$ There is much useful advice in this post, but I'm having a hard time finding a way to agree with your conclusion that "your model fits the data very well." The low $R^2$ suggests it does not. The p-values are low merely because the dataset is sufficiently large (1722 observations). Indeed, a closer inspection of the data shows the response is very strongly heteroscedastic, which--coupled with the evident fact the response is a count--ought to dispose one towards fitting a GLM rather than a least squares model. $\endgroup$
    – whuber
    Commented Jan 18, 2019 at 18:34
  • 1
    $\begingroup$ You are both incorrect. A low p-value for testing for the presence of any association does not have anything to do with examining goodness of fit, and $R^2$ measures explained variation but does not relate to goodness/badness of fit. The only way $R^2$ can be used to assess badness of fit is if you embed your model in a more flexible one and the flexible model's $R^2$ is much higher than the smaller model's. But more thought needs to be put into selecting a model that is tailored to count data. $\endgroup$ Commented May 9, 2019 at 11:25
0
$\begingroup$

There are a few things to discuss here:

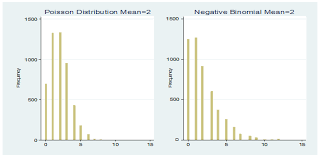
  1. Your model is aiming to predict count data. This leads one to believe that you should be using either Poisson regression or Negative Binomial regression. However, this will depend on the distribution of your data. If the distribution of your outcome looks like either of the distributions in the following image:

    Poisson and NB dist.

    then these are the regression methods you should be using (dependent on the overdispersion of your data). Linear regression follows the assumption that your outcome is normally distributed.

  2. Using categorical predictors is still valid even if your outcome is continuous. For linear regression, you would code the variables as dummy variables (1/0 for presence/absence) and interpret the predictors as "the presence of this variable increases your predicted outcome by its beta". Your "Reality" variable with a beta of 2422.87 is suspect, despite a statistically significant p-value. This should be further evidence of using a different regression model. Using Poisson or Negative Binomial regression will have different interpretations of the betas though, so be careful.

  3. R-squared can be interpreted as "explaining __ % of the variability in the outcome variable". Your R-squared value is low, and with five predictor variables this is also highly suspect. R-squared should go up with each new predictor, so this shows that despite the predictors being statistically significant, they are not increasing the explanatory power of the model very much. Further evidence that this may be the incorrect model.

Normally, I would suggest doing some model diagnostics to help examine model fit. For linear regression, the residuals should be normally distributed. However, in your case, I would suggest examining the distribution of your outcome variable. My gut tells me it is not normally distributed (as is required for linear regression), and follows a Poisson or Negative Binomial distribution. Perhaps you could examine and comment if you have more questions.

$\endgroup$

Your Answer

By clicking “Post Your Answer”, you agree to our terms of service and acknowledge you have read our privacy policy.

Not the answer you're looking for? Browse other questions tagged or ask your own question.