2
$\begingroup$

I have monthly data since 1990 to January 2019 and I need to make a forecast of the next 6 months so I use a sample of the past ten years(I used a sample of the last ten years due to my job requirement). The problem is that the order of the estimated ARIMA changes when I change de sample, i.e., I find that the best order of ARIMA for the sample 2009 to 2018 is an ARIMA(1,1,1) (I used auto.arima function) but when I change the sample e.g. 2008 to 2017 the best model is an ARIMA(1,1,2) and so on, the order of ARIMA changes when I change de sample. Is it ok that I change the model every time I need to do the forecast (I have to do the forecast every month rolling the sample) or I have to select a fix order of ARIMA?

Thanks!

$\endgroup$

2 Answers 2

3
$\begingroup$

There is a process out there that generates a new value each month for the series you're studying. This process is unknown to you, but you're trying to figure out what it might be by looking at only 1 realization of the process, which your sample is a subset of. If the process changed over time, then your sample is really a union of two samples from 2 different processes. Think of a series of your favorite exchange rate before and after Bretton Woods, with exchange rates essentially fixed prior to 1972 and floating thereafter. In such a case, estimating a model for the entire time period, without adjusting for the change/break in the process, is tantamount to assuming that there is one and same, unchanged process generating all the values of your time series, which is an incorrect assumption. The fact that your sample suggests that it was produced by an ARIMA (1,1,1) process if you use one set of dates and ARIMA (1,1,2) if you use a different set of dates suggests that there may have been a break in the process at some point.

Did you plot the series? Did you plot the first-differenced series? If you haven't, make sure you do plot them. A stationary process has a constant mean and constant variance (among other properties), and a visual inspection of your series and of its first difference may be informative on that front. Visual inspection of the graph may also be fruitful in hypothesizing break dates, if applicable. You'll want to make sure that there is also some theoretical, intuitive reason for a break.

A break in the process would imply that the process is non-stationary. You can test for a break in the process in two ways, which differ based on whether you know when the break occurred. In the first case, if you know the break date, you'll use the Chow test, in the second one you'll use the QLR test, which essentially performs a Chow test for every single date in your dataset and picks the date with the greatest evidence for a break in the process.

One you've confirmed that your process had a break, you can reflect it in your model by adding a dummy variable (0 before the break, 1 after the break) and also interact your break date dummy variable with all the (relevant) regressors (in your case, these would be the AR and MA terms). The Chow test mentioned above is essentially an F test that the coefficient on the break date dummy and all the coefficients on the break date dummy date interacted with other regressors, are all zero. The QLR test is essentially same as the Chow test, except that it conducts an F test at the date at which it found the F-statistic to be the highest.

Because you do not know when the break occurred, use the QLR test to determine the break, unless visual inspection of the graph yielded a hypothesis for the break, supported by theory and intuition, in which case you can use the Chow test.

$\endgroup$
1
$\begingroup$

ColorStatistics' answer is already very good. I'd just add that there is no need to look to structural breaks for an explanation. Straightforward sampling variance, as ColorStatistics discusses in the first paragraph, will do quite nicely. That is: even if your data generating process does not change (i.e., there is no break), the variability inherent in a stochastic process will mean that the result of your automatic ARIMA fitting will give slightly different results each time you take a sample.

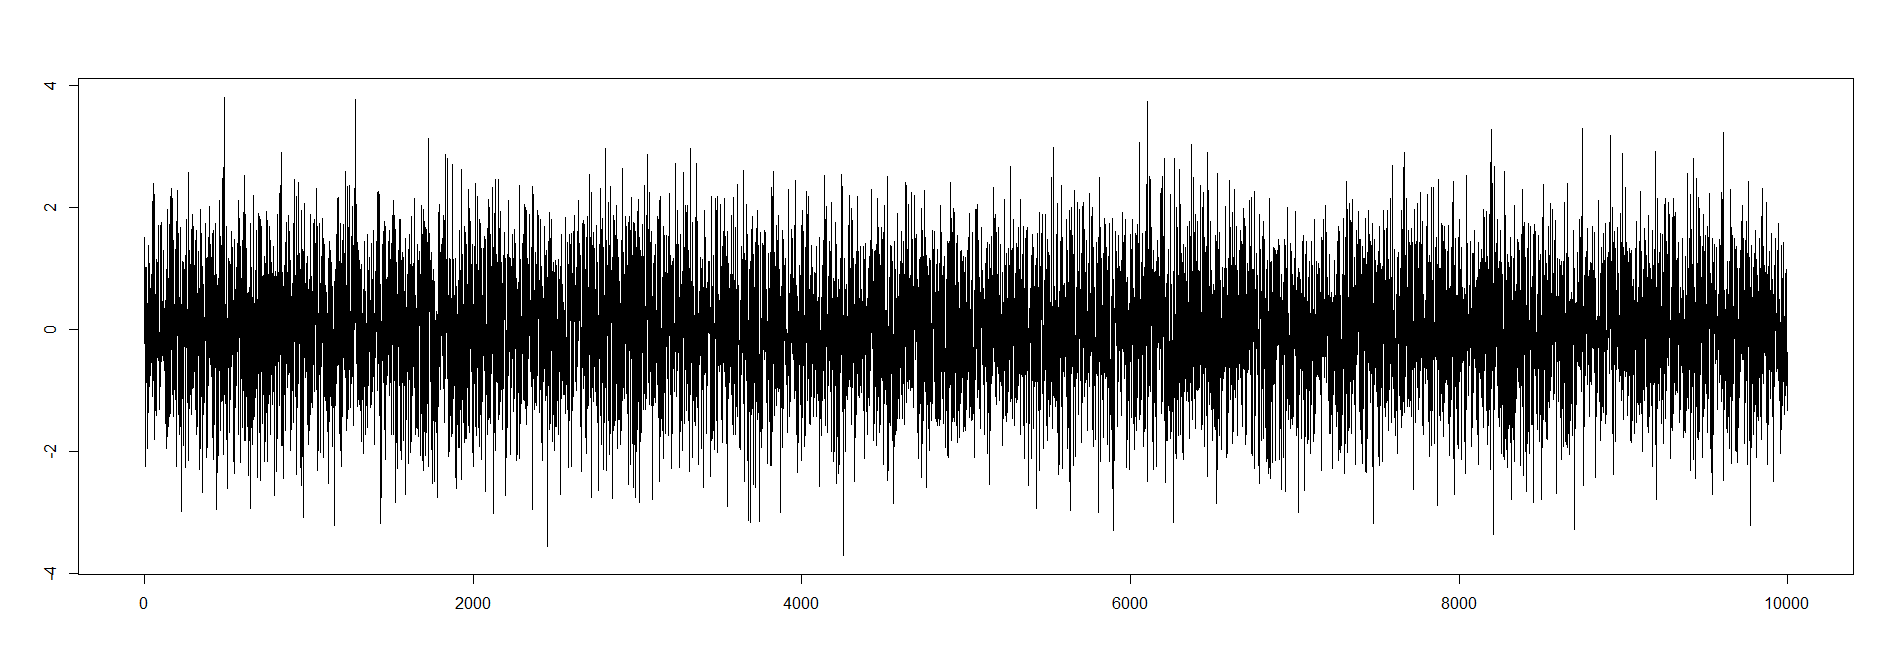
I like simulations to get an idea of the effects of inherent variability. Let's simulate a series of 10,000 realizations of an ARMA(1,1) series, with AR parameter $\phi_1 = 0.3$ and MA parameter $\theta_1 = -0.2$.

series

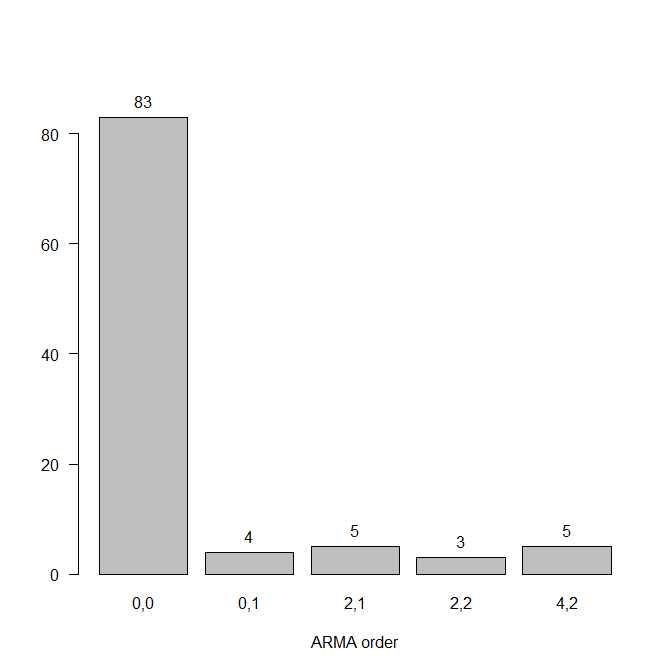
Now we fit an ARIMA model to observations 1-100. Then to observations 2-101. Then to 3-102. And so on.

We end up with 100 different ARIMA models, all from an underlying ARMA(1,1), so we know the underlying reality. Questions:

  1. How often do the fitted ARMA models yield different orders?
  2. How often do we recover the actual ARMA(1,1) model?

Answers:

  1. The majority model is fitted 83 times, others 17 times.
  2. We do not recover the original model order a single time.

barplot

Of course, the effect will depend strongly on the length of your subsamples (if we take samples of length 1,000, things will look better), and the strength of the signal (if the ARMA coefficients are larger in absolute terms, things will look better). But even so, we will get variable results each time we sample the data.

So, to answer your question: no, it's perfectly fine if your models differ between model runs with different observations. That happens. (And if you are looking at monthly data, I'd encourage you to also look at seasonal models, like seasonal ARIMA, also known as SARIMA. Your software should consider these automatically if you correctly specify that your data may have a period of length 12.)

$\endgroup$

Your Answer

By clicking “Post Your Answer”, you agree to our terms of service and acknowledge you have read our privacy policy.

Not the answer you're looking for? Browse other questions tagged or ask your own question.