5
$\begingroup$

I have the following time series:

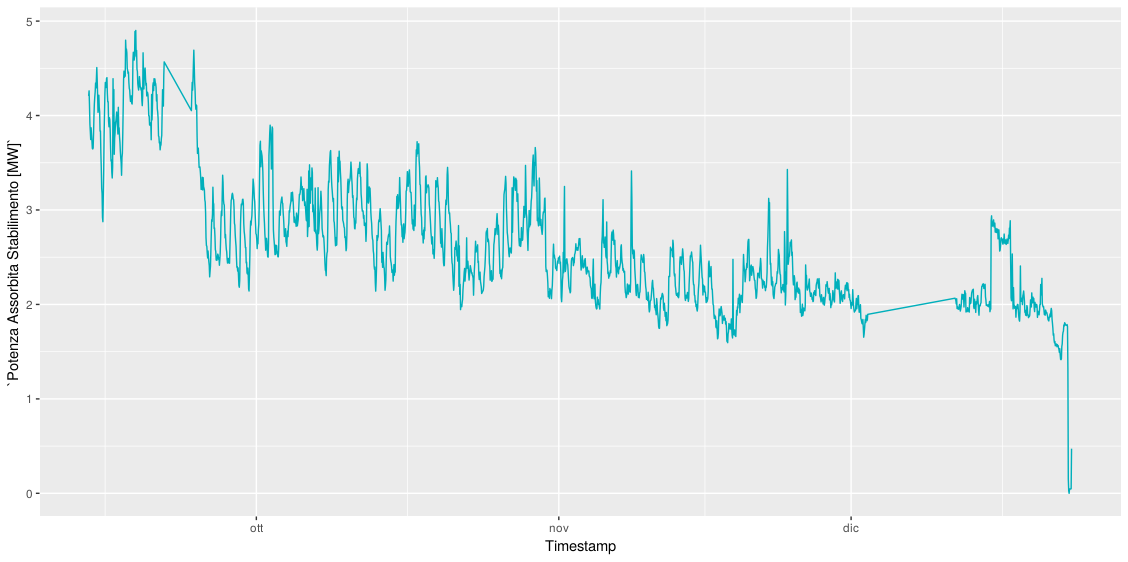
enter image description here

Data is aviable here data

The time series represent an hourly eletricity load. It starts at 2018-09-13 19:00:00 and end at 2018-12-23 15:00:00.

I want to predict the next 36 hours values.

I tried several method but without success.

This is my code:

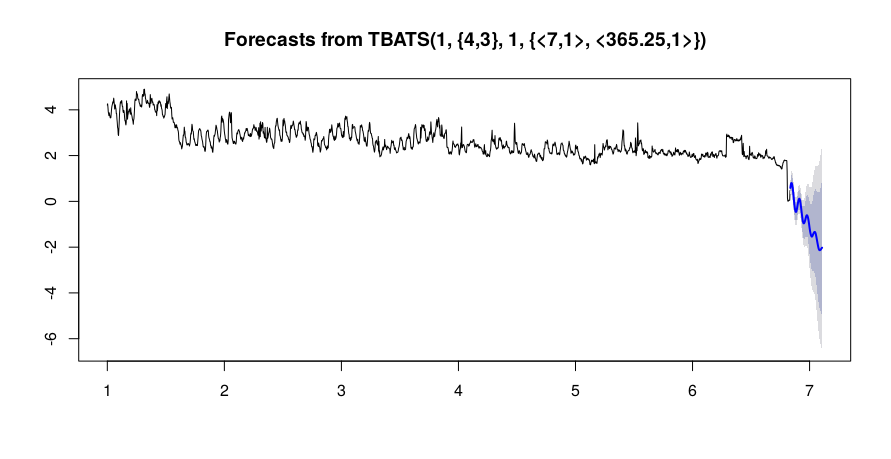
load.msts <- msts(df$Power), seasonal.periods = c(7, 365.25))
load.tbats <- tbats(load.msts)
load.pred <- forecast(load.tbats, h = 100)

The result of prediction is: enter image description here

Then i tried:

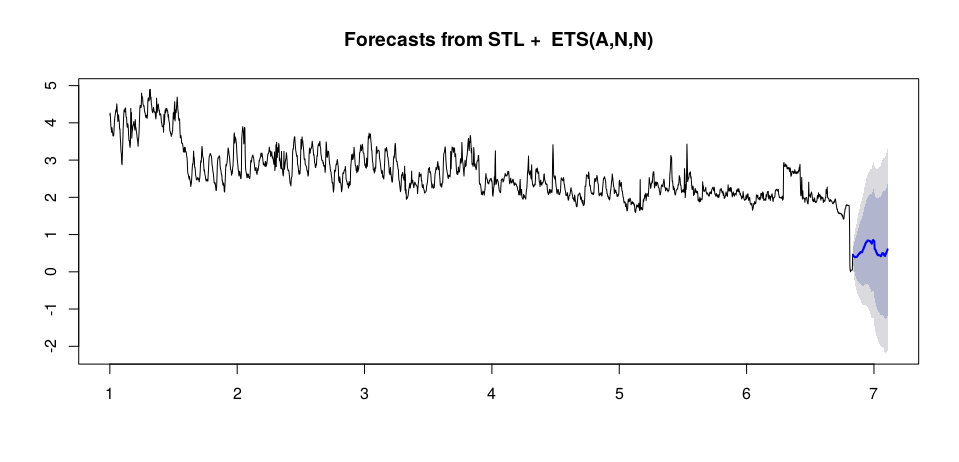
load.stlm <- stlm(load.msts, s.window = 'periodic', method = 'ets')
load.pred <- forecast(load.stlm, h = 100)

The result of prediction is: enter image description here

I have also tried Facebook prophet:

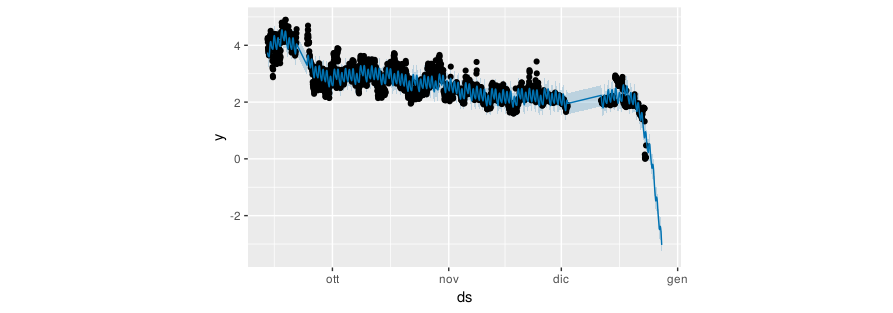
load.prophet.df <-prophet(load.df,yearly.seasonality=TRUE)
load.prophet.model <- make_future_dataframe(load.prophet.df, periods = 
200, freq = 3600)
load.prophet.pred <- predict(load.prophet.df, load.prophet.model)

Results: enter image description here

I think that the problem is related to the amount of data. I don't have enough data ( only one year of data).

How can improve my forecasting? Thx

$\endgroup$
3
  • 2
    $\begingroup$ The degree of uncertainty is too high for sensible prediction. If someone goes on vacation, and turns off the electricity, the best way to predict usage would be to ask how long they will be gone. $\endgroup$
    – Carl
    Commented Jan 30, 2019 at 11:10
  • $\begingroup$ Would it be possible to post or append the data? Either in plain text or via a data sharing tool like sharecsv.com $\endgroup$
    – Jim
    Commented Jan 30, 2019 at 12:25
  • 1
    $\begingroup$ yes. I've upload csv [link] (sharecsv.com/s/f2b58c4304ffa69599fb5ef09f70eb6e/…) $\endgroup$
    – LorNap
    Commented Jan 30, 2019 at 13:02

3 Answers 3

3
$\begingroup$

Your problem is not (so much) a lack of data. Your problem is that the data generating process changes abruptly multiple times. First there is a step change around Sep 20, then there is a period of strangely low variability at the beginning of November, almost two weeks of missing data at the beginning of December, and finally a precipitous drop at the end of December.

The last is a particular problem for your models, and it will be for any model. Your models fit either a downward trend, which they extrapolate (TBATS and Prophet), or another step change (ETS). Which one makes more sense? We don't know, since we don't know what happened recently, whether the downward trend will continue, or whether your series has reached a new equilibrium, or whether it will increase again to the level it showed before the drop.

I'd very much recommend you find out what happened to your series in the past, and include this in any model. For instance, you could regress your series on explanatory variables and fit your time series to residuals. This is related to How to know that your machine learning problem is hopeless?

$\endgroup$
1
$\begingroup$

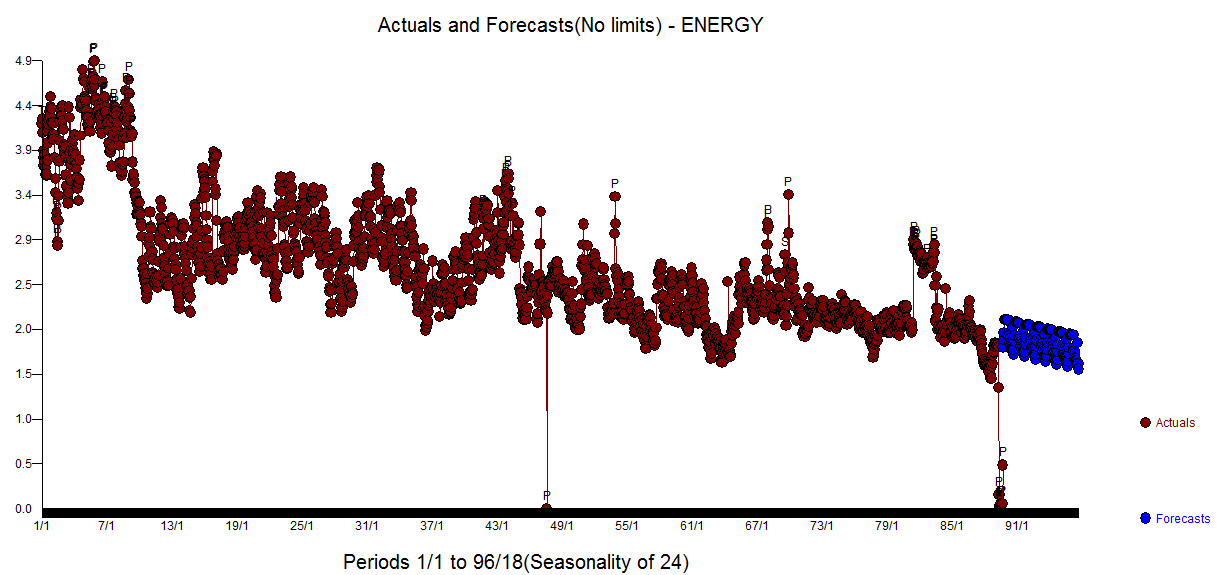
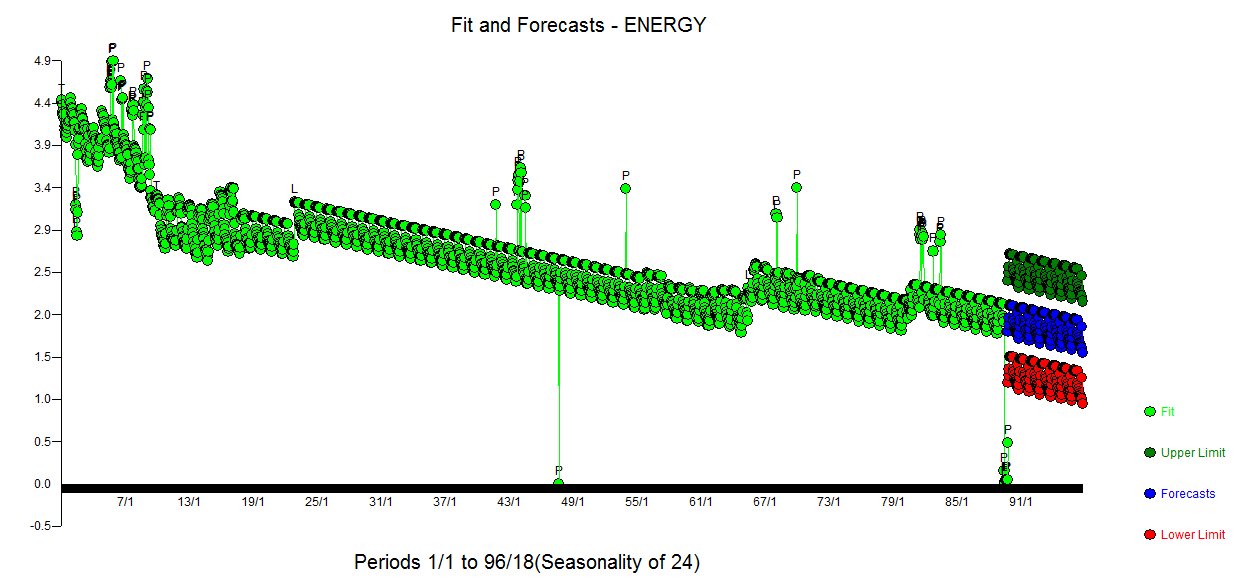
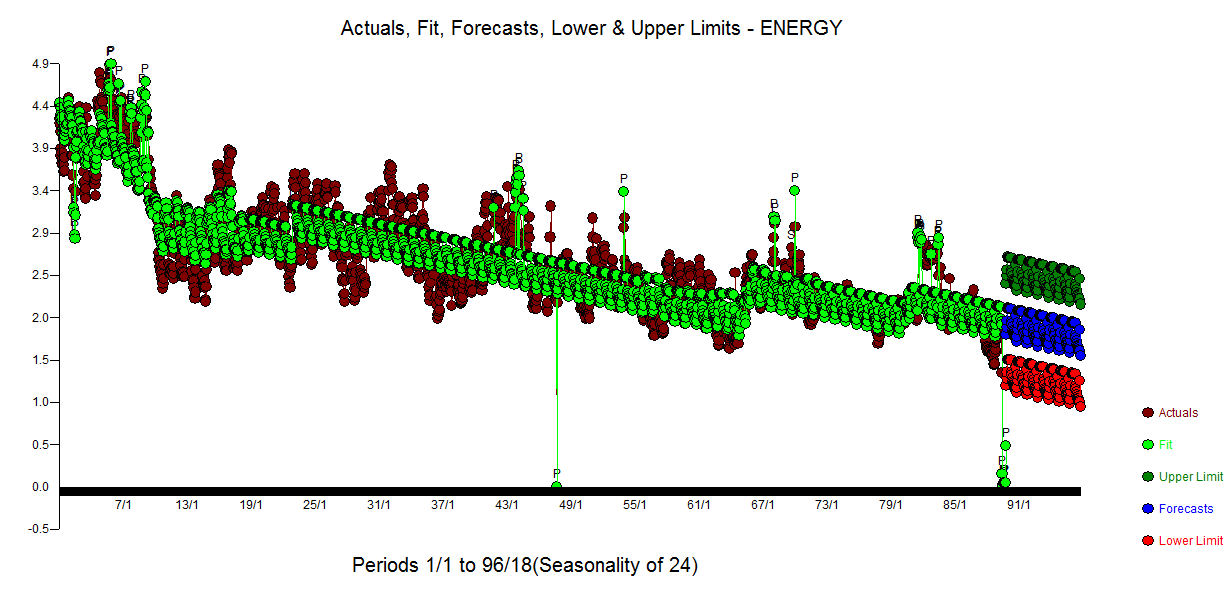
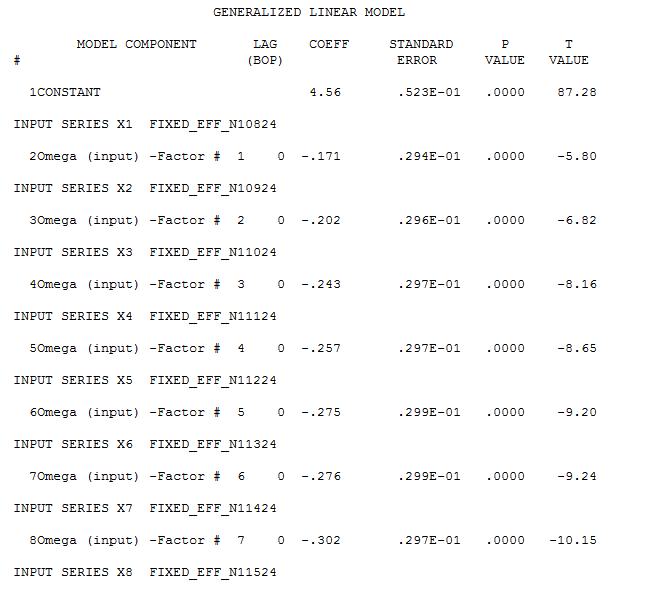
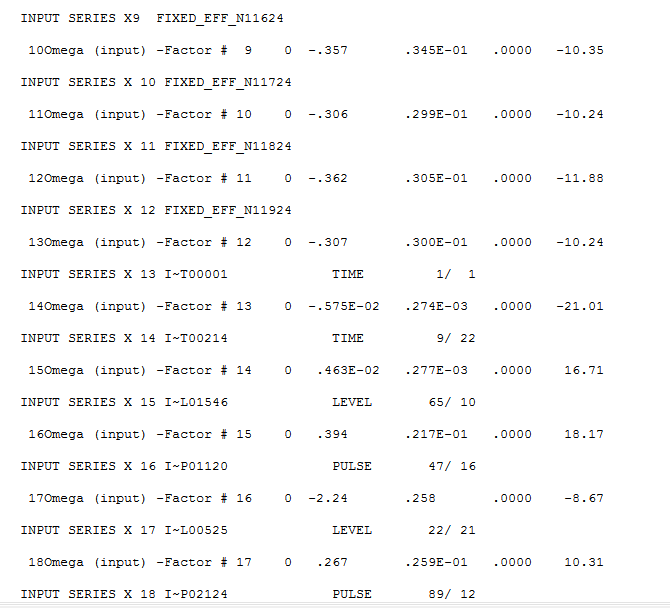
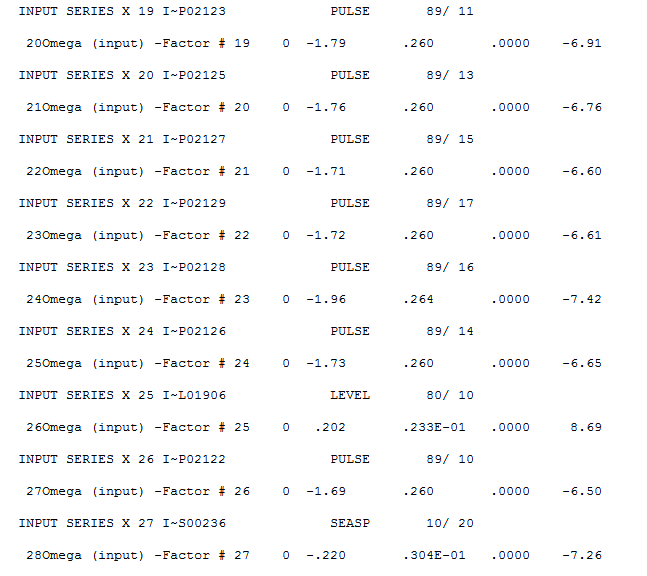
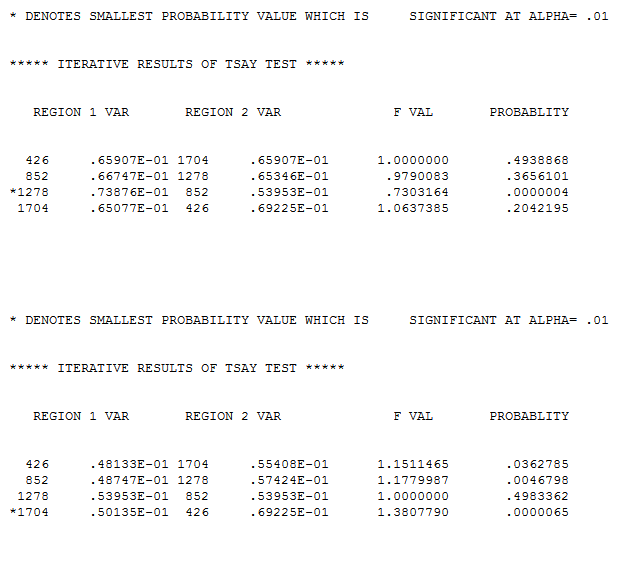
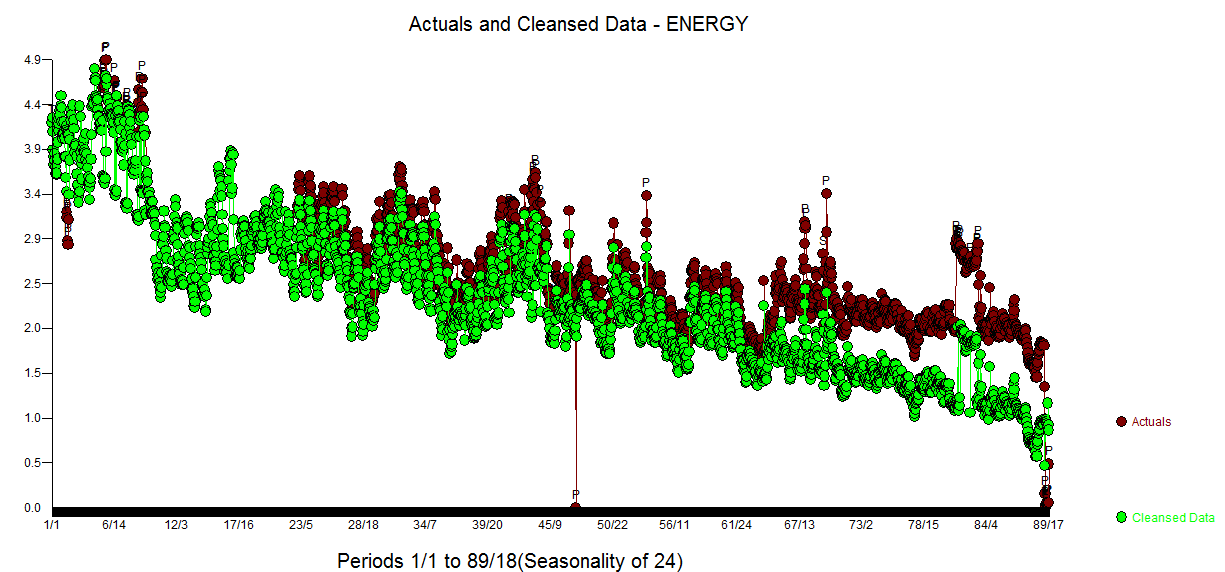
The problem you are having is that the softwares you have tried didn't 1) detect the unique repetitive impact of 12 specific time periods in your 24 hour cycle , periods 8 through 19 2) detect the change point in trend at period 214 3) detect the intercept changes at period 546,528 and 1906 4) detect the (NOW VISUALLY OBVIOUS !) change points in model error variance change at periods 1278 and 1704. I used AUTOBOX which treats the data by examining not only memory effects (arima) BUT deterministic effects. AUTOBOX was developed ( partially by me ) to deal with data sets like this that are often real world and totally outside trivial solution spaces which try to pigeonhole the data into pre-specified models rather than trying to actually identify/tune the model based upon the actual data.

As others have pointed out the severe drop off suggested by the many recent pulses needs to be investigated and either believed to be a new regimin or adjusted for as AUTOBOX did. Your forecast will depend on this research.

Here is the Actual and Forecast graph enter image description here

Here is the Fit and Forecast graph enter image description here

Here IS the Actual/Fit and Forecast genter image description heregraph

The equation is here in 3 parts enter image description here

enter image description here

enter image description here

and the TSAY test http://docplayer.net/12080848-Outliers-level-shifts-and-variance-changes-in-time-series.html for constant error variance

enter image description here

Here is the Actual and Cleansed enter image description here

Unless your software of choice challenges the assumptions and provides remedies there may be some hidden cost for using it.

$\endgroup$
0
$\begingroup$

As Carl pointed out, the degree of uncertainty is too high. If you want your model to be able to predict a certain periodicity in data, you need of have at least one cycle of the data where that periodicity is observed. Because the model hasn't "learned" that periodicity yet! So if the sudden decrease in data at the end (the part you have tried to predict) is something you think is periodic, you have to provide a range where that has already happened once, so the model can anticipate that.

Secondly, I think your data is not stationary, and has a decreasing trend (at least in the given range). Standard statistical methods work well on stationary data, so you might have to convert into stationary data to obtain better performance.

$\endgroup$
2
  • $\begingroup$ I thought the same thing. I will try with differencing data $\endgroup$
    – LorNap
    Commented Jan 30, 2019 at 13:05
  • $\begingroup$ the range should ( at a minimum ) be at least twice the period not once . Secondly non-stationarity can often be remedied by de-meaning the data stats.stackexchange.com/questions/385684/…. $\endgroup$
    – IrishStat
    Commented Jan 30, 2019 at 13:21

Not the answer you're looking for? Browse other questions tagged or ask your own question.