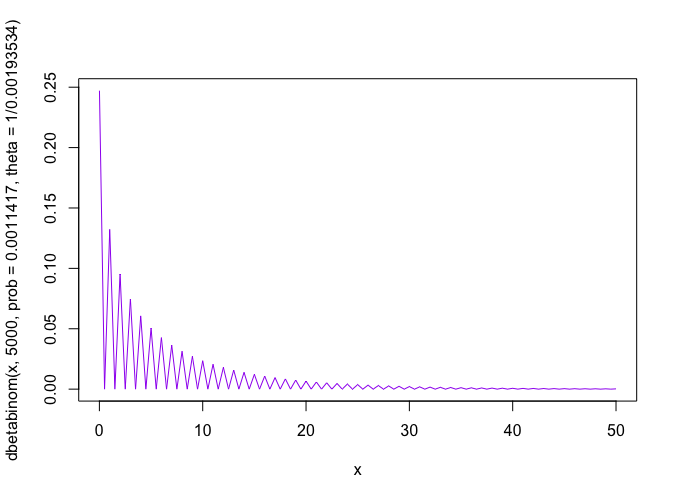
I have N distinct bernoulli trials with a distinct probability for each trial given by, P=(p1, p2, ..., pN). I want to know the distribution of the number of successes. Given that I know P, I can fully describe the distribution with a poisson-binomial distribution. As expected, the result is almost identical to the poisson distribution with rate=N*mean(P), since N=5000 is large and mean(P)=0.00114 is small.

I can also easily compute the parameters to a beta distribution from P, and describe the distribution of successes with a beta-binomial distribution.
Why are the two distributions so different? This is my main question.
Clearly they respond to variance in P differently. When I artificially reduce the variance in P for the BB distribution by 1/20 the BB distribution mimics the shape of the PB.

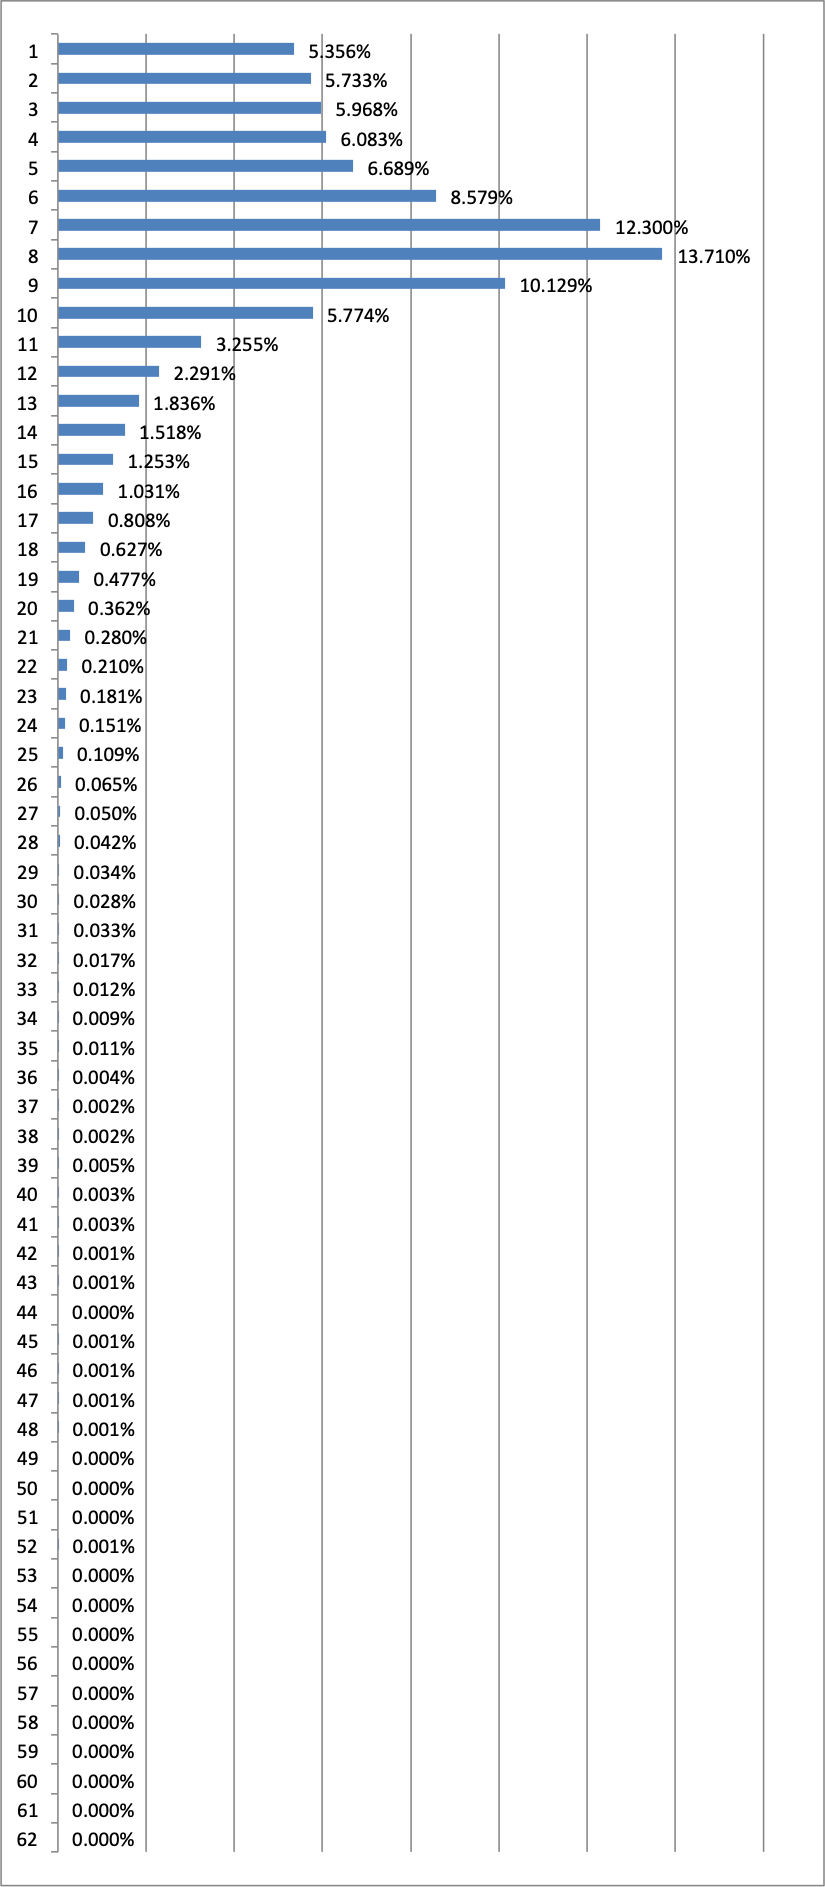
When I examine a histogram of actual data for a fairly large sample (80k+ data points, each with N trials), the resulting distribution looks like the PB and BB distributions have been combined. So I am unsure which best describes the data, and why.
Thanks!


