2
$\begingroup$

I am working on a time series forecasting problem ,I used Dickey–Fuller test to check the stationary of the time series and the p value is 0.000835 , hense I rejected the null hypothesis and assumed that it's a stationary time series.

I decomposed the time series and the trend component does not have any particular pattern.plot-enter image description here
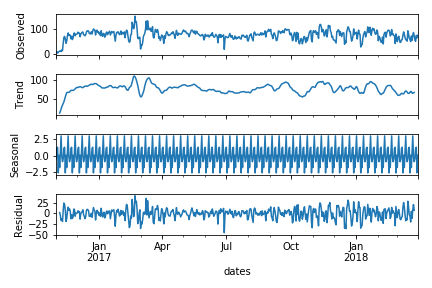
I want to ask how can we justify that a time series has any particular trend, Is this decomposition enough to ensure and guarantee that this time series has no trend ?

Plot of rolling mean-

enter image description here

Plot of rolling variance-

enter image description here

$\endgroup$

2 Answers 2

3
$\begingroup$

The Augmented Dickey–Fuller test is UNIT ROOT test - NOT a stationarity test. The null-hypothesis on this test is that the data have been generated by a restricted AR model containing a unit-root. Rejecting this hypothesis DOES NOT mean the series is stationary. It just means that there is enough evidence to allow you rejecting the hypothesis of a very specific form of NON-stationarity (i.e. unit root). Evidence is assessed contrastively i.e. v.s. an unrestricted AR model. Rejecting the hypothesis that an animal is a chicken with an alternative being a pig doesn't mean the animal might not be a horse! The examined animal might contrastively not look like a chicken (e.g. because it has 4 legs) but that doesn't make it a pig.

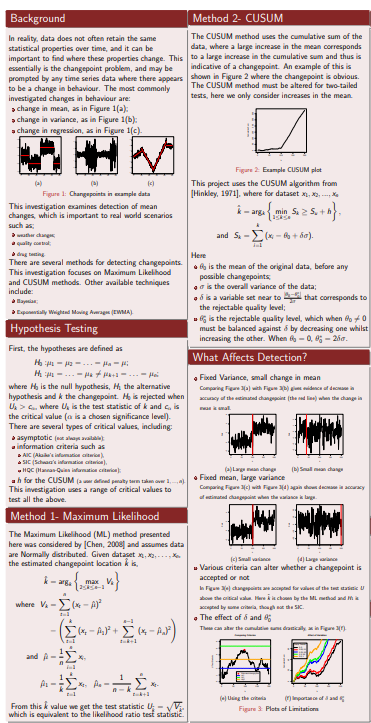
Now look at your decomposition. You could see with a bare eye data don't look stationary. Trend as well as variance change with time. The decomposition does not support your conclusion. It supports the opposite view. There both parametric as well as non-parametric ways to check changes in the trend of the series. For example (see following poster about Detecting Changes in the Mean ):

test

$\endgroup$
1
  • $\begingroup$ Thanks for the clarification regarding the Dickey–Fuller test.I have added the plots of rolling mean and variance of the time series with a window of 10.It's observed that the variance is almost constant with some fluctuations while the mean has many change points. I am using R package changepoint to detect the change points ,but I want to ask is there any method to forecast the future change points/ give a probability to the future points that they may be change points. $\endgroup$
    – A.kumar
    Commented Mar 16, 2019 at 7:42
2
$\begingroup$

visually there is an apparent autoregressive process and a change in model error variance .. thus non-stationarity is the call.

$\endgroup$

Your Answer

By clicking “Post Your Answer”, you agree to our terms of service and acknowledge you have read our privacy policy.

Not the answer you're looking for? Browse other questions tagged or ask your own question.