1
$\begingroup$

We have a study involving 10,000 patients, 5,000 of them treated with drug A and 5,000 with drug B. We want to know if drug A is more effective than B. The median time to event (death) after treatment with drug A is 1,000 days and for drug B it is 2,000 days. Suppose we wish to subsample 100 patients receiving either treatment (200 total) from this larger sample to test the same hypothesis.

There are two proposed subsampling strategies:

  1. We are given data (time to event) for 100 patients who received drug A and 100 patients who received drug B.

  2. We are given data for 100 patients who died between 800-1200 days after treatment (some of them received A, some B, we pick randomly) and data for 100 patients who died between 1800-2200 days after treatment.

For the two cases above, which are the appropriate analytical tools to consider? Which has more power?

$\endgroup$
4
  • $\begingroup$ Is data missing in scenario 2 (for patients who died between 1201-1799 days afeter treatment)? Then I think we have better power in scenario 1. $\endgroup$ Commented May 14, 2019 at 23:31
  • $\begingroup$ The total number of samples in the two scenarios are equal. In the second scenario we pick samples at specific time periods. $\endgroup$
    – mghandi
    Commented May 15, 2019 at 0:38
  • $\begingroup$ Just to confirm you don't actually pick the subjects based on their treatment in case 2, you rather mean to say that selection is not conditional on treatment assignment. $\endgroup$
    – AdamO
    Commented May 15, 2019 at 17:45
  • $\begingroup$ Yes. In this model we don’t know the treatment before selecting patients. $\endgroup$
    – mghandi
    Commented May 15, 2019 at 21:11

2 Answers 2

1
+50
$\begingroup$

These scenarios should be remarkable similar. In survival analysis, it is helpful to think about the cumulative observation time as informative regarding the precision and standard errors. For instance, in a sample where 200 die, if another 5,000 are observed who do not die, they can contribute to the precision of the estimates of HRs. Deaths remain the main (but not sole) driver of power. In Cox models this is made explicit by the risk set.

Considering that approximately half the sample lives past 1,500 days it's perhaps not a coincidence that in scenario 2 you subsample in an arbitrary interval around the median survival for the two balanced groups (e.g. $\pm 200$). That does not mean that, on average, the number of person-days of observation will or will not be the sample in the two scenarios. The more powerful sampling strategy will be the one which has a highest person years of observation period, provided all the appropriate modeling assumptions are met.

Suppose we consider person-days of observation for one treatment group. The actual distribution of event times will determine whether the subsample of events falling in a symmetric interval around the median actually comprises a greater survival time. As an example, consider survival times exponentially distributed.

set.seed(123)
surv <- rexp(5000)
i <- surv[abs(surv-median(surv)) < 0.1]
n <- length(i)
sum(i) ## PD-fu in scenario 2
mean(replicate(1000, sum(sample(surv, n)))) ## average PD-fu in scenario 1

gives

> sum(i) ## PD-fu in scenario 2
[1] 338.1843
> mean(replicate(1000, sum(sample(surv, n)))) ## average PD-fu in scenario 1
[1] 485.7077

so the unconditional sample includes more persons having longer event time follow-up, and hence would be slightly more powerful.

$\endgroup$
2
  • $\begingroup$ Could you elaborate a bit about the follow up time metric that you used in your analysis. For example if on the third row of your code you change median with 2*median would that give better sampling?? $\endgroup$
    – mghandi
    Commented May 15, 2019 at 21:17
  • $\begingroup$ @mghandi not necessarily. That was just an arbitrary decision on my part. I compare sampling all individuals within a range of the median vs sampling the same number unconditional on survival time. Sampling some individuals* in a larger range of the median lies somewhere between the two methods in terms of efficiency. $\endgroup$
    – AdamO
    Commented May 16, 2019 at 13:39
1
$\begingroup$

Scenario 2 can't in general be counted on to demonstrate a survival difference between drugs A and B.

For example:

Say that with drug A 1/3 of patients die before 800 days, 1/3 die between 800 and 1200 days (with half of those before and half after 1000 days), and 1/3 die between 1800 and 2200 days.

Say that with drug B 1/3 of patients die between 800 and 1200 days, 1/3 die between 1800 and 2200 days (with half of those before and half after 2000 days), and 1/3 die after 2200 days.

Then you have the specified median survivals of 1000 days for A and 2000 days for B. Median survival is clearly better for B.

Nevertheless, 1/3 of both groups die between 800 and 1200 days, and 1/3 of both groups die between 1800 and 2200 days. Sampling scenario 2 would show no difference in deaths between drugs A and B despite the longer median survival with drug B.

Yes, the above example might be extreme. You don't, however, want study design to depend on untestable assumptions about the shapes of survival curves, hidden assumptions that underlie the proposal of sampling scenario 2.

With scenario 1 you directly get information about the shape of the survival curves. That would be important for testing the proportional-hazards hypothesis that underlies the Cox regression proposed in an earlier version of this question. (Note that for a simple 2-treatment comparison you could use a log-rank test in scenario 1 and avoid such assumptions.)

Scenario 1 also gets your results faster. This calculator for survival studies with 2 equal groups at the start shows that, under your assumptions (200 patients in total with data, all starting at day 0, 1000-day median time to failure with drug A, a hazard ratio of 2) you will have 80% power to detect (at p < 0.05, log-rank test) a survival difference after 850 days of follow up. There will only be 46 deaths total at 850 days. You will barely have started collecting data under Scenario 2 at that time.

It's frankly hard to think of a situation in which scenario 2 would be preferable, although that might just indicate the limits of my imagination. For example, under your hypotheses with exponential survival curves, I calculate that 59% of the deaths between 800 and 1200 days would be with drug A, while 51% between 1800 and 2200 would still be with drug A. If you wanted, say, to compare those proportions between the 2 time intervals as a test of differences in survival, Russ Lenth's power calculator indicates that you would have less than 20% power to detect that difference in A/B proportions with only 100 deaths sampled within each time interval.

If you would like to explore different sampling times like sampling scenario 2, the following plot shows the fraction of all deaths that occur in patients who took drug B, as a function time into the study, within 400-day windows, with exponential survival times.
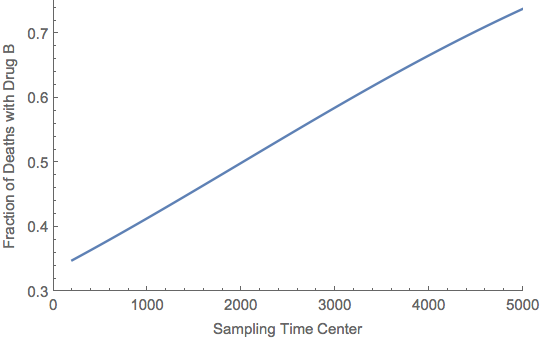
Fraction of deaths with drug B versus time

Remember that scenario 1 gets you useful results by 850 days. That takes advantage of the low proportion of drug B deaths at early times so it's easiest and fastest to see differences between A and B at early times. As the sampling time gets later the difference in deaths between drugs A and B in the types of time windows you propose gets smaller (making it harder to detect B/A differences) until they are about equal at 2000 days, after which increasingly more deaths are associated with drug B and B/A differences become easier to detect. Again, it's hard to see what that type of sampling approach would provide over the standard scenario, scenario 1.

$\endgroup$
1
  • $\begingroup$ Thanks for the answer. What if the survival curves for A and B have a simple exponential form (with Poisson distribution for the time of event with median 1000 for A and 2000 for B).? $\endgroup$
    – mghandi
    Commented May 15, 2019 at 16:32

Your Answer

By clicking “Post Your Answer”, you agree to our terms of service and acknowledge you have read our privacy policy.

Not the answer you're looking for? Browse other questions tagged or ask your own question.