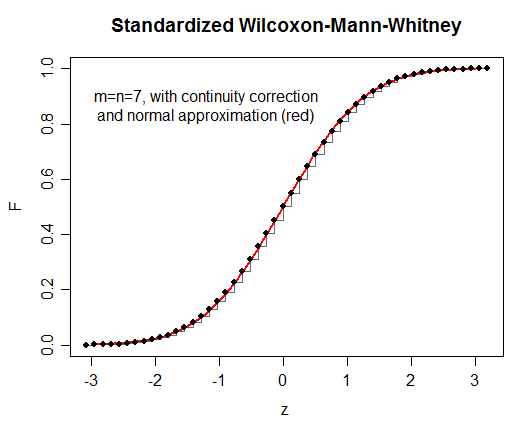
The error message is slightly misleading. If there are no ties, there are (fairly simple) ways to calculate the exact distribution (when $H_0$ is true) of the Wilcoxon-Mann-Whitney test statistic (and the signed rank test statistic), and R comes with the usual functions - pmfs, cdfs, inverse cdfs and random generators for both.
If there are ties, it is still possible to calculate the distribution of the statistic, but it's no longer so easy and may become quite time consuming.
However, a standardized version of this statistic $\frac{U-\mu_U}{\sigma_U}$ (and $\frac{W-\mu_W}{\sigma_W}$ for the signed rank) has a distribution that fairly quickly (as sample sizes become larger) becomes close to a standard normal distribution, and that can be used to get an approximate p-value for either test.

Which is to say, the vertical position of the black dots (and consequently, calculation of p-values) may be closely approximated by the height of the red curve at the same value. Even at fairly small sample sizes the approximation is often quite good.
Exactly the same kind of thing happens with the signed rank test.
When there are ties, this approximate normality is still the case (though it happens more slowly, especially with a lot of ties), and while it is altered by the presence of ties, we can calculate the population standard deviation if we know what the pattern of tied ranks is.
The formula for the standard deviation when there are ties is given at the relevant Wikipedia page
While the Wikipedia article for the signed rank test doesn't seem to give it, there's a similar change to the formula for the standard deviation of the signed rank test under ties (see Conover, Applied Nonparametric Statistics, for example) and everything proceeds in essentially the same way in either case.
As for why it happens as sample sizes grow, you can write either statistic as a sum of terms, and hence (with a little care) apply a version of the Central limit theorem.

