[This question is mainly a reference request.]
I'm searching for a somehow concise and complete table of prototypical distributions that would allow a test person to easily choose which typical distribution he or she assumes or prefers
in a specific context, e.g. concerning income, health and life expectancy, well-being, political orientation (opinion), etc.
in his/her own country or world-wide
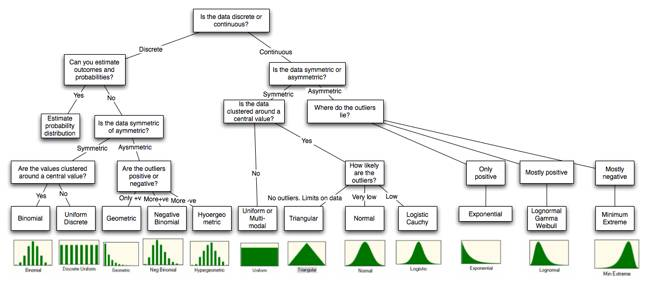
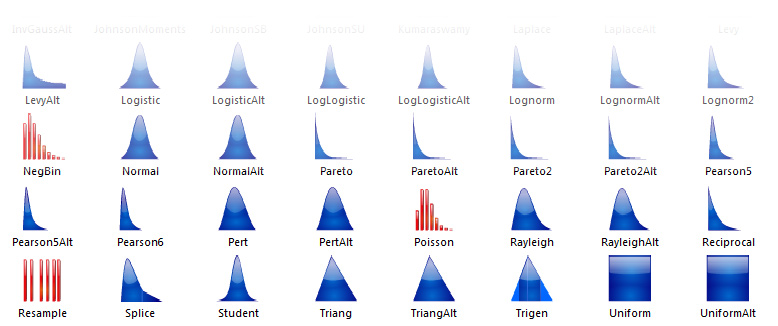
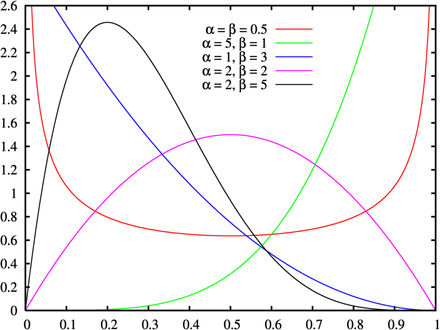
These are some examples I have found, but they are neither concise, complete nor well-displayed enough:
 https://blog.cloudera.com/blog/2015/12/common-probability-distributions-the-data-scientists-crib-sheet/
 https://magesblog.com/post/2011-12-01-fitting-distributions-with-r/
 https://www.palisade.com/risk/monte_carlo_simulation.asp
 https://www.wikiwand.com/en/List_of_probability_distributions#/Continuous_distributions
Can anyone give me a link to a concise tabular overview of prototypical distributions (with one, two, three maxima and minima, preferrably with mean and median highlighted)?
If there is no such tabular overview around, I'll create it on my own.
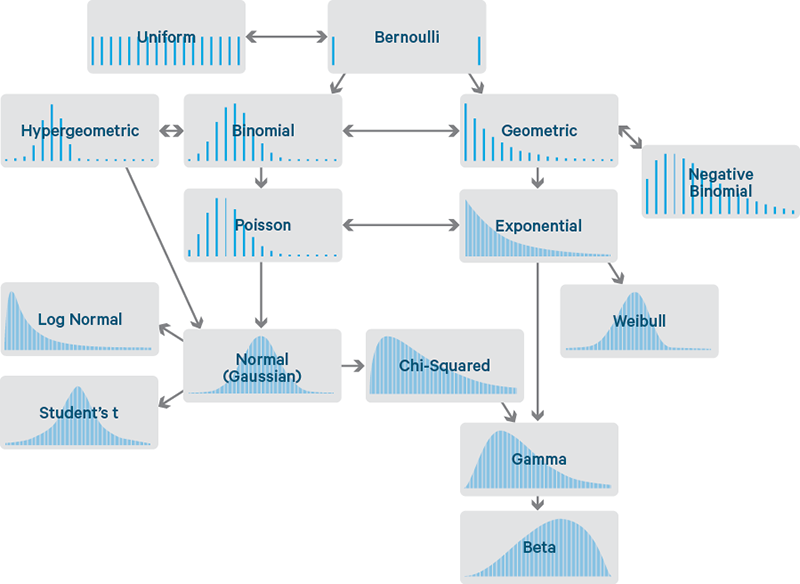
To be more specific: In the context of my question there's no significant difference between Normal, Student's t and Weibull distribution. And none between Log Normal, Chi-Squared and Gamma. But between Gamma and Beta. And between Log Normal and Exponential (see first image above).
