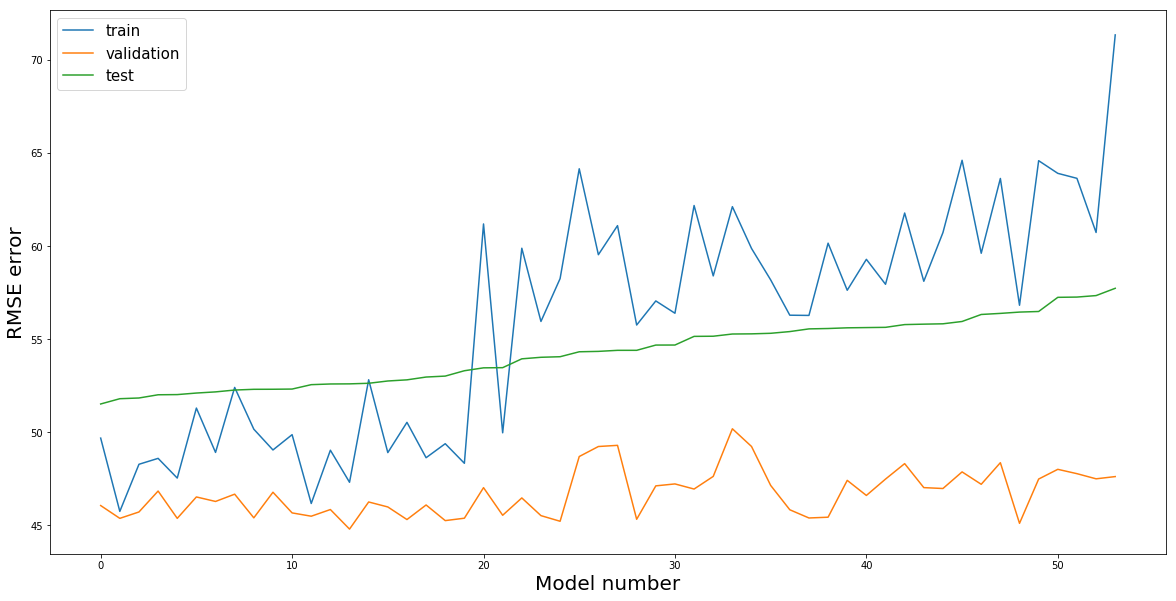
Following this tutorial and this question of mine, for 54 different architectures, I have created 7 fold of Time series nested cross validation and calculated their average RMSEs along the folds. Here is the plot of results for each model (sorted by test errors):

    Train RMSE  Val. RMSE   Test RMSE
0   49.687797   46.066586   51.520229
1   45.753350   45.379110   51.802998
2   48.282409   45.721729   51.841783
3   48.600064   46.845202   52.014357
4   47.541941   45.378764   52.024013
5   51.300506   46.528276   52.107319
6   48.919367   46.286362   52.169052
7   52.408936   46.677165   52.268566
8   50.166622   45.407038   52.307951
9   49.050966   46.781303   52.310827
10  49.872758   45.671953   52.321291
11  46.177456   45.494021   52.557310
12  49.036850   45.852280   52.594011
13  47.316358   44.802460   52.600244
14  52.821173   46.258382   52.631585
15  48.910266   45.990957   52.754455
16  50.534043   45.315262   52.815753
17  48.635029   46.097369   52.966606
18  49.386921   45.257947   53.017332
19  48.335603   45.386894   53.304866
20  61.186672   47.027477   53.460612
21  49.972194   45.545195   53.470178
22  59.882552   46.475939   53.944369
23  55.951904   45.525361   54.027113
24  58.252209   45.222602   54.057611
25  64.149203   48.698381   54.323094
26  59.535415   49.236504   54.344255
27  61.096072   49.298675   54.400525
28  55.760195   45.328589   54.401031
29  57.053078   47.123611   54.683293
30  56.392229   47.227539   54.685360
31  62.176391   46.952841   55.149935
32  58.396399   47.631487   55.158098
33  62.114717   50.188596   55.276931
34  59.871759   49.238543   55.285609
35  58.184016   47.148222   55.315562
36  56.286819   45.840154   55.407579
37  56.275041   45.399141   55.552131
38  60.154595   45.440626   55.572438
39  57.626510   47.418812   55.609291
40  59.286548   46.609070   55.622315
41  57.947627   47.487280   55.635283
42  61.773251   48.317250   55.783020
43  58.108373   47.029473   55.806003
44  60.723731   46.981426   55.825117
45  64.604817   47.873297   55.950005
46  59.613294   47.207958   56.326126
47  63.628736   48.368041   56.384107
48  56.820503   45.111788   56.454283
49  64.583549   47.489629   56.486057
50  63.903845   48.011409   57.246105
51  63.635471   47.778477   57.260250
52  60.728946   47.501679   57.340145
53  71.336779   47.621872   57.731262
Now I want to select the best model. What is a bit confusing for me is that the test errors for some models are less than train errors.
From this answer, the answerer claims that when Training errors are higher than test errors, the model is not properly fitted to the data. ( Although He didn't introduced a threshold.)
- Are Those models with training errors higher than test errors, not good enough?
- From the plot, I concluded that the best model is the first one (Test RMSE = 51.520229). Is this selection procedure satisfactory?
