2
$\begingroup$

enter image description here

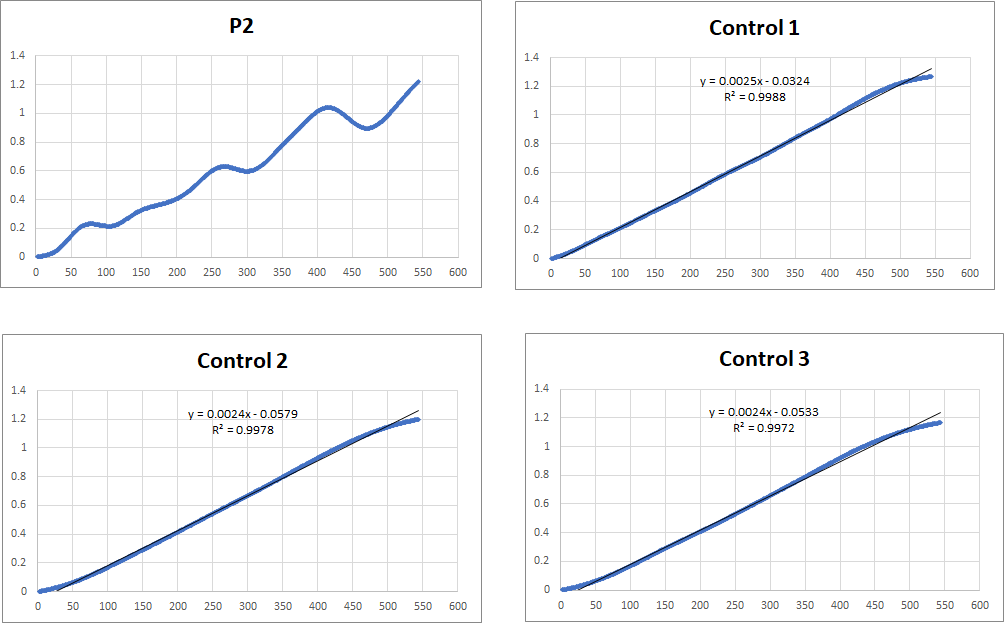
I have some measurements of displacement vs time of movement of a particle. Between these measurements, I have some particles that are supposed to not be moving at all (these are the control samples). Therefore, all my measurements have noise.

I would like to remove this noise by using the control samples; the measurements I'm having from my control samples are supposed to be pure noise while graph P2 is real displacement+noise.

Is there any method that I can use to remove this noise using my control samples?

thanks

$\endgroup$
10
  • $\begingroup$ How? Are the noises correlated? Such that the control and non-control samples move in similar directions? Or is noise completely random? $\endgroup$ Commented Sep 5, 2019 at 7:28
  • $\begingroup$ completely random noise $\endgroup$
    – Ivan
    Commented Sep 5, 2019 at 9:43
  • $\begingroup$ Can you post an example plot of such movements between control and non control samples? $\endgroup$ Commented Sep 5, 2019 at 9:48
  • $\begingroup$ sure @user2974951. this is a link with two plots. the one in the left is the control one. imagizer.imageshack.com/img922/1060/RLv2m4.png $\endgroup$
    – Ivan
    Commented Sep 5, 2019 at 10:25
  • $\begingroup$ This helps, also, you can post images in your question using the edit button. Based on this graphs I cannot really see any patterns, it seems to be moving pretty randomly through time, the control sample has slightly less variation than the non control sample. I don't know if this can be done. Why are you trying to remove noise anyway? $\endgroup$ Commented Sep 5, 2019 at 10:58

1 Answer 1

1
$\begingroup$

As already discussed in the comments, since your data seems to be following a very nice (mostly) straight path, you can estimate the trend in your data - the controls, such as via simple linear regression, and then subtract this from your non-control samples.

Alternatively, since all the samples seem to be on the same scale, you could also subtract the trend by decomposing each time series individually, and retaining only the seasonal and remainders.

$\endgroup$
2
  • $\begingroup$ thanks again. Just to be sure that I did the right thing. The "x" axis is the same for samples and controls. So for every "i" value, being "i" the time, I calculated the mean from the controls. Then from the main samples I subtsratced the calculated mean (the one from the controls). $\endgroup$
    – Ivan
    Commented Sep 14, 2019 at 10:16
  • $\begingroup$ @Ivan I wouldn't do it like that, what I would do is estimate the mean slope and intercept for all the control samples together (unless you did a paired experiment, that is one control vs. non control), similar to what calculated in the image you posted (y=0.0025x-0.05), except this would be an aggregate for all the control samples. Then you use this formula to subtract the average slope from your non control samples, since you can calculate the average value of this function at any point. $\endgroup$ Commented Sep 15, 2019 at 19:08

Your Answer

By clicking “Post Your Answer”, you agree to our terms of service and acknowledge you have read our privacy policy.

Not the answer you're looking for? Browse other questions tagged or ask your own question.