I have a time series data that I wish to be able to obtain the general performance of it. For that, I use nested cross-validation with time series flavor as described in this amazing blog.
As you have to start with an initial window size, I choose my window size to be 52. The outer fold is mainly done at each time step left, from timestep 53 onwards.
For each outer fold, I compute the average error, in this case, RMSE in order to be able to see the error's fluctuation/trend as we move through the time steps. I wish by the end of the day to be able to see that the error decreases as I move forward with timesteps and to reach a point were it stabilizes.
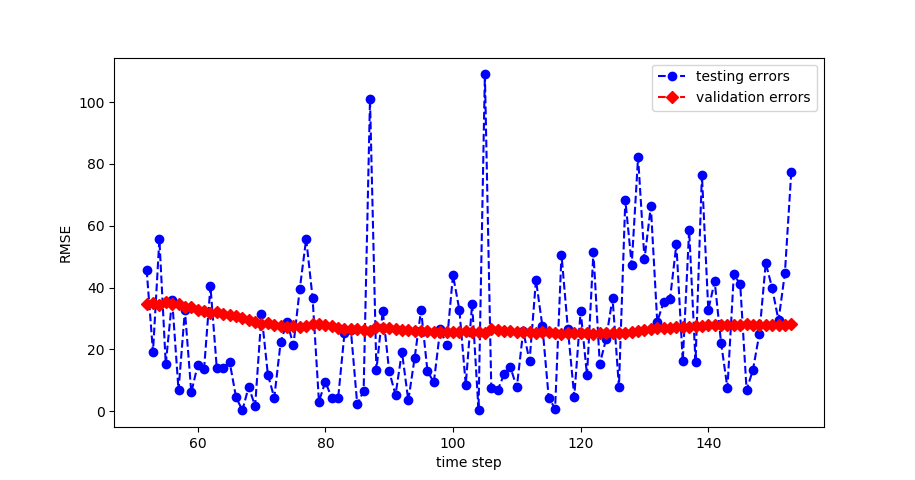
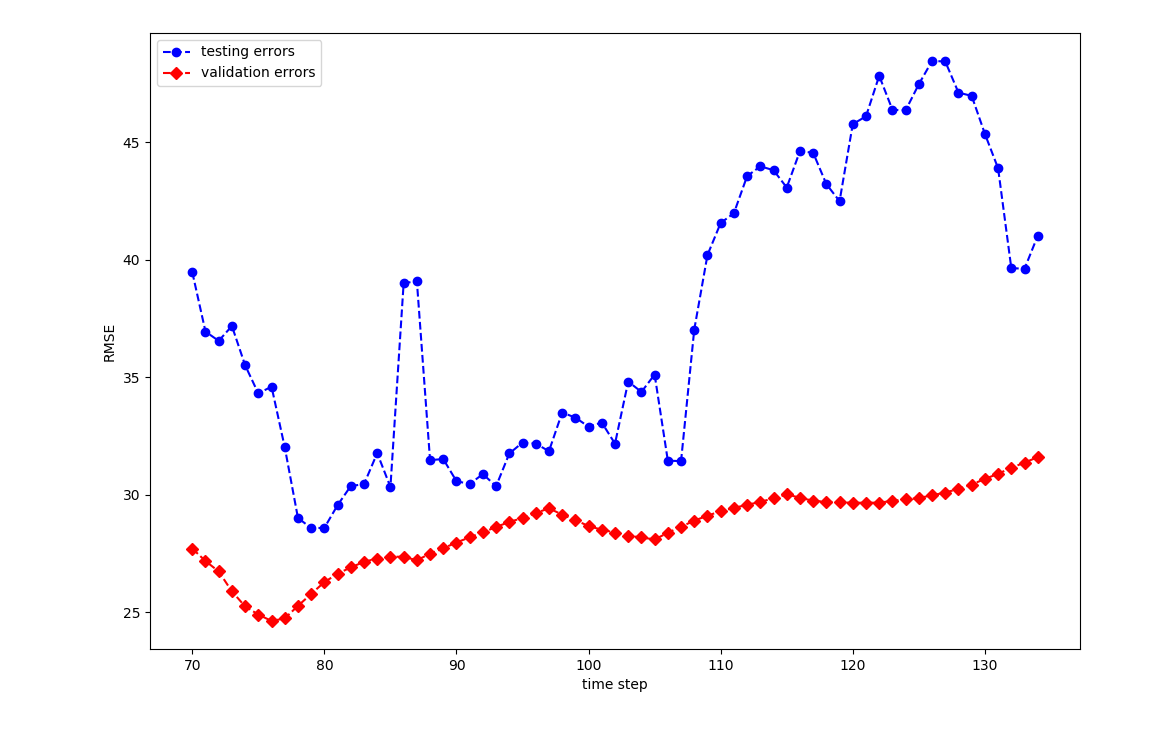
I know that the error in each outer fold might be affected with the choice of the hyperparameters from the inner fold. However, I do have model stability (i.e. the chosen set of hyper parameters from the inner fold is the same). However, I plot the change in the outer fold's RMSE over the time steps and this is what I got:
The so-called 'testing errors' is the RMSE of each outer fold, and the so-called 'validation errors' is the average RMSE of each inner fold.
I am surprised from the harsh fluctauations in the outer fold RMSE. Can someone explain:
- Is that normal ?
- If not, what might be the reason?
- Also if not, what shall I do to make this better and more stable ?
- The validation error is stable, which is a good sign, isn't it ?
Note: My dataset is small in size (154 samples). I am unable to collect more data.Also, the

