I read this paper, and at the end of page 841 there is this sentence:
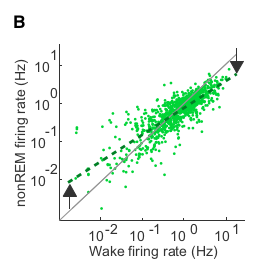
demonstrating that state transitions exert a differential
effect across the firing rate spectrum (slope, 95% confidence interval 0.66–0.71)
What really means the value 0.66–0.71? How it is obtained?
I couldn't find more detail in the article...
Thanks a lot
EDIT : Extract from the paper:
 (B) Differential effect of brain state on neurons of different firing rates. Comparison of the firing rates (log scale) of the same pyramidal neurons during WAKE and
nonREM—each point is the same neuron in two states. During nonREM, neurons at the right end of the distribution are decreased, but neurons at the left end of
the distribution increase their rates compared to WAKE (arrows).
