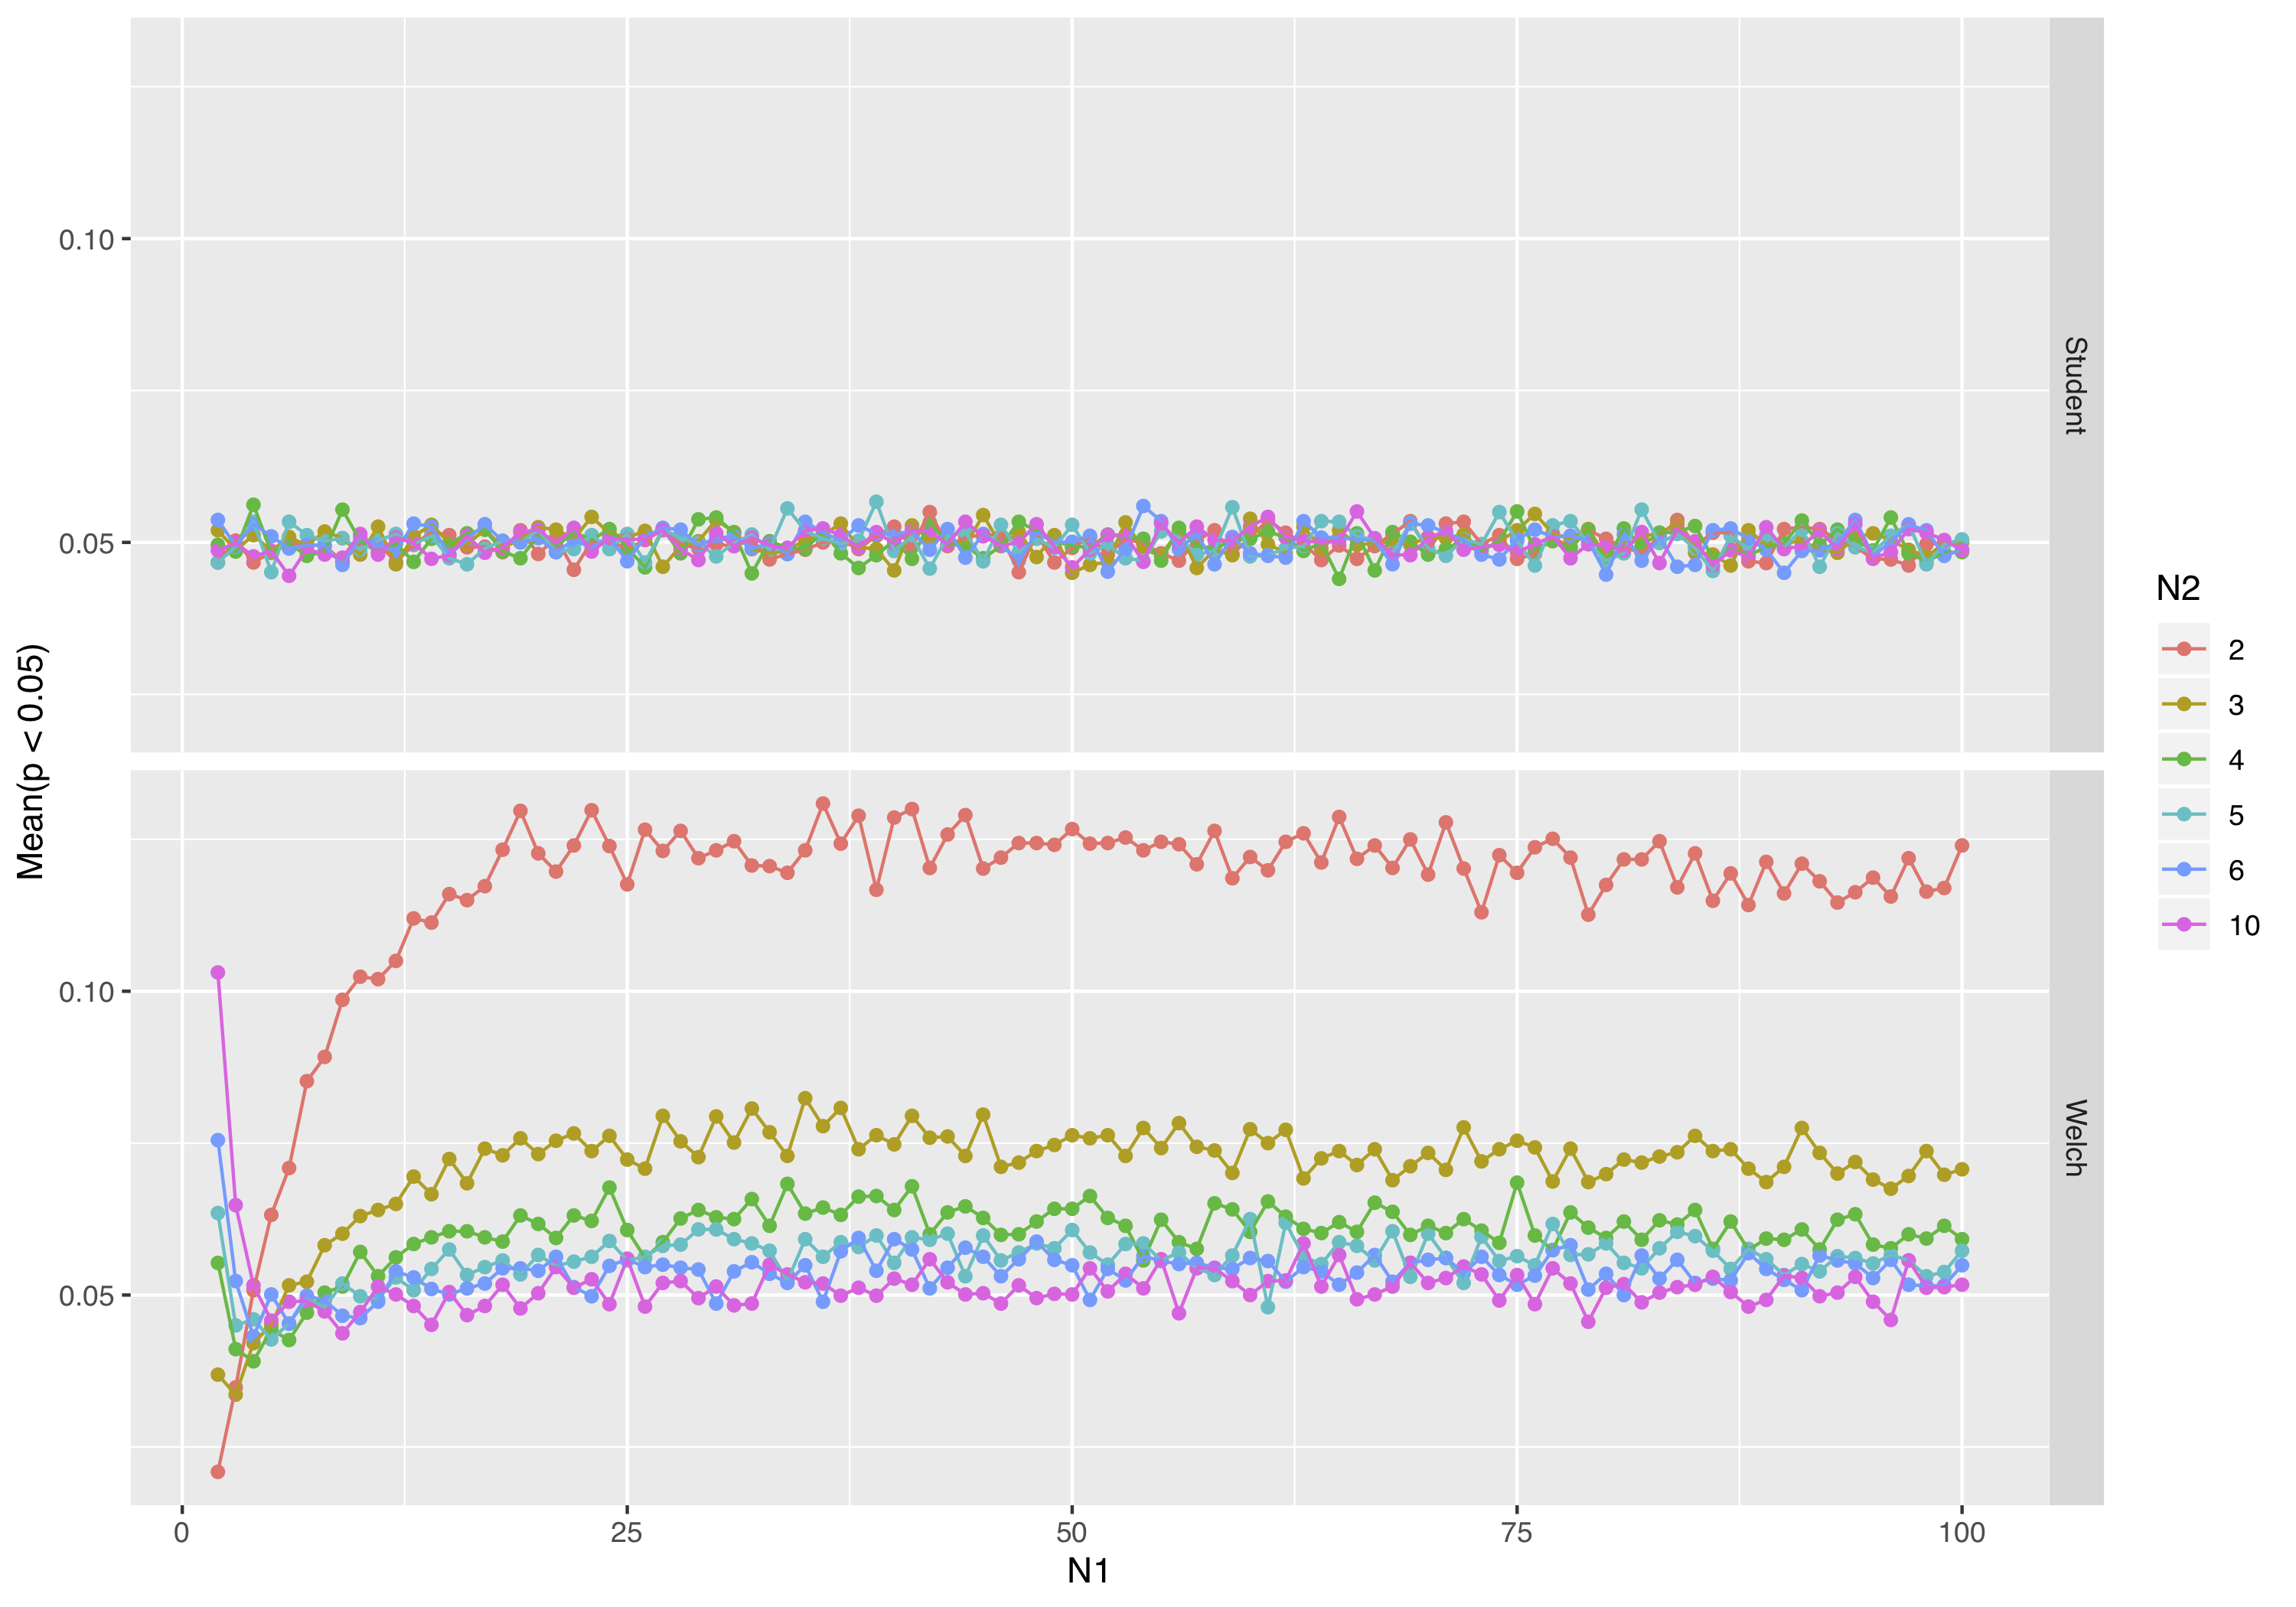
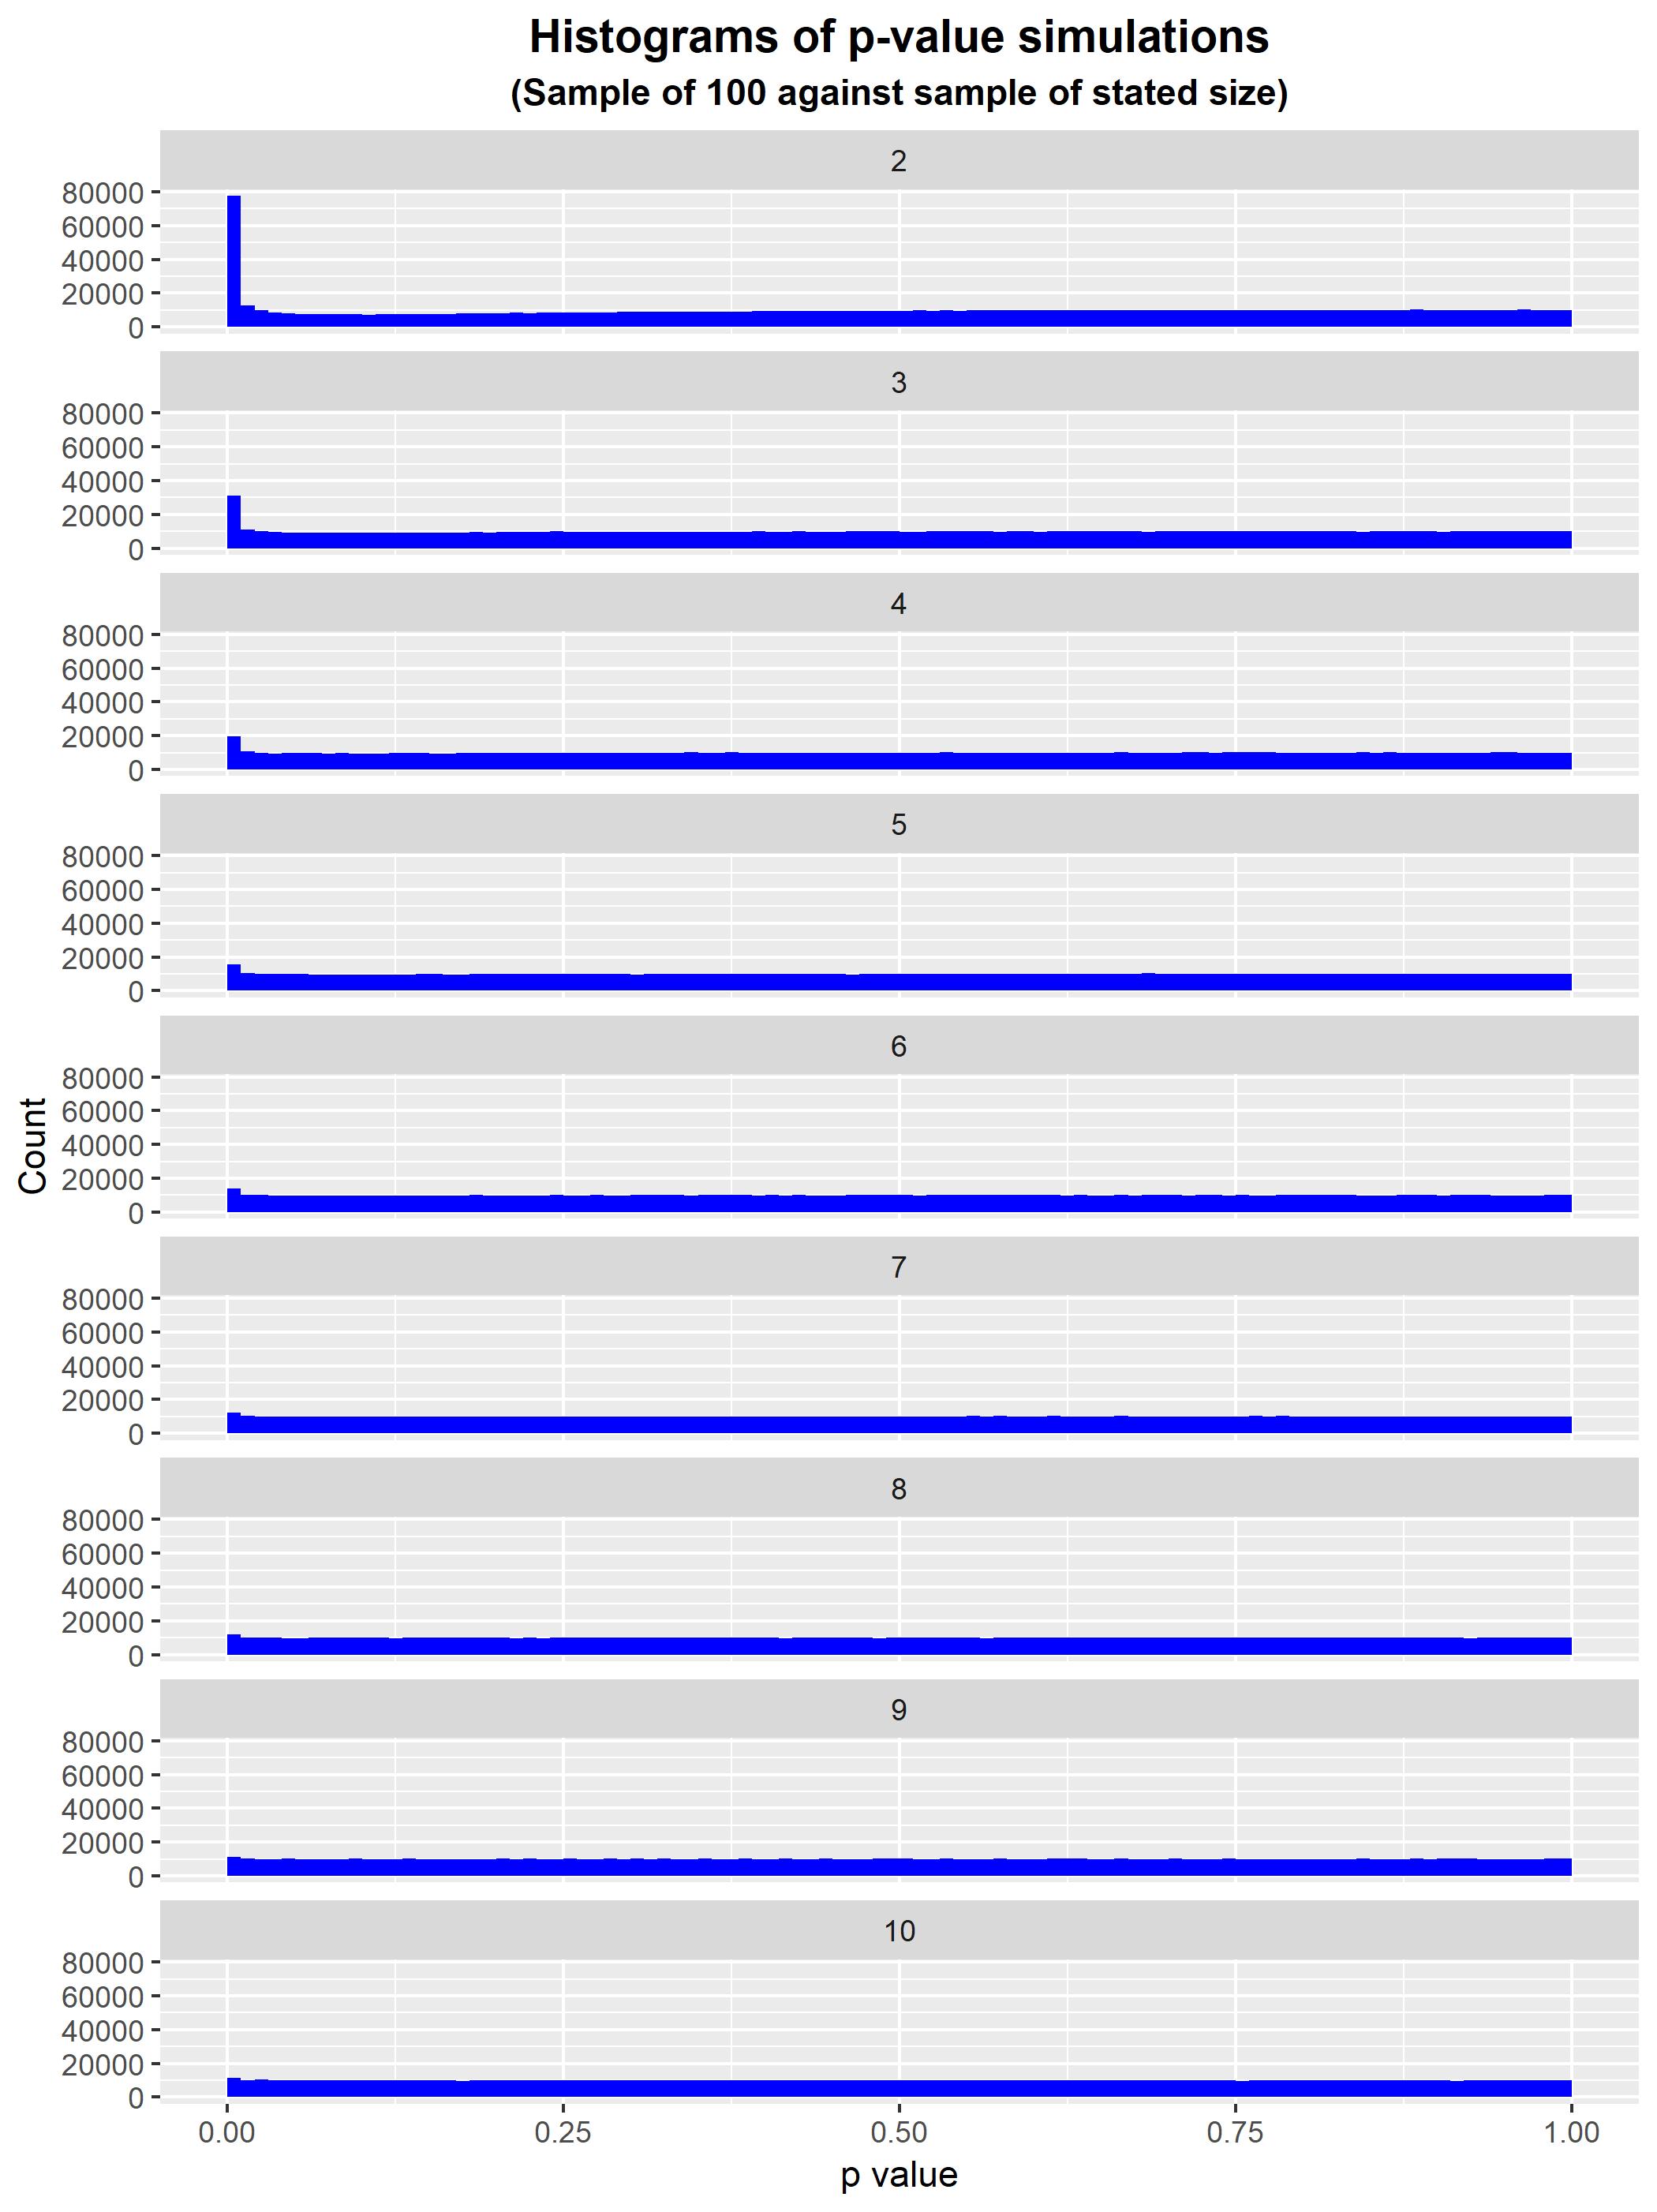
It seems that in some cases Welch's t-test can give inflated p-values with imbalanced group sizes. For example, consider the following simulation of unequal group sizes sampled from the same Gaussian distribution.
set.seed(42)
sapply(2:10, function(n) {
  out <- replicate(100000, t.test(rnorm(100), rnorm(n))$p.value)
  mean(out < 0.01) / 0.01
})
# [1] 7.928 3.139 1.913 1.606 1.371 1.285 1.178 1.141 1.192
Is this conclusion correct? Are there general guidelines on group sizes for when a Welch's t-test is appropriate? Are there known ways to correct this apparent bias, or should we in general assume equal variance if groups are imbalanced in terms of size?
Update:
To clarify, I'm interested in establishing minimum sample sizes for a Welch t-test, below which we need to be cautious about the possibility of false positives (restricted to the situation where we are happy to assume equal variances).
I think this figure of a simple simulation of samples from the same distribution, with varying sample sizes more cleanly illustrates the issue. In all cases, we expect the mean number of tests with p-value < 0.05 to equal 0.05 if the test performs as expected.
I would conclude that we need to be cautious with a Welch t-test if N < ~5 for any group, particularly if N = 2.
Note, I've not investigated unequal variance, which as BruceET has pointed out can cause potentially high false positive rates when not accounted for.
dosim <- function(var.equal) {
  sapply(seq_len(nrow(g)), function(i) {
    pv <- replicate(
      reps,
      t.test(rnorm(g[i, "N1"]), rnorm(g[i, "N2"]), var.equal = var.equal)$p.value
    )
    mean(pv < 0.05)
  })
}

reps <- 10000
g <- expand.grid(list(N1 = 2:100, N2 = c(2, 3, 4, 5, 6, 10)))

g$Welch <- dosim(FALSE)
g$Student <- dosim(TRUE)
g <- tidyr::gather(g, "stat", "value", "Welch", "Student")
g$N2 <- factor(g$N2)

ggplot(g, aes(x = N1, y = value, col = N2)) +
  geom_point() +
  geom_line() +
  facet_grid(stat ~ .) +
  ylab("Mean(p < 0.05)")
Related:


