85
$\begingroup$

I am designing a one year program in data analysis with a local community college. The program aims to prepare students to handle basic tasks in data analysis, visualization and summarization, advanced Excel skills and R programming.

I would like to prepare a set of short, real world examples that illustrate where ordinary intuition fails and statistical analysis is necessary. I'm also interested in "famous statistical fails", but more interested in the wins. The data involved should be freely available.

A perfect example of what I'm looking for is the Berkeley discrimination case, which illustrates Simpson's paradox. The data for that is memorialized in R's datasets.

Historical cases are also interesting. John Snow's analysis of the Broad Street pump data is a good example of the power of visualization.

There are a lot of fails in the collection of data (selection bias), etc. and the literature in medical statistics is full of them.

A lot of "statistical wins" occur in the area of variable selection and sampling design. I'm interested in paradoxes that occur in other areas -- like the analysis as such.

$\endgroup$
7
  • 2
    $\begingroup$ See this recent question: stats.stackexchange.com/questions/432866/… $\endgroup$
    – Dave2e
    Commented Nov 1, 2019 at 13:19
  • 5
    $\begingroup$ A very great number of examples in any edition of Statistics (Freedman, Pisani, and Purves) are of this nature: that's one reason it's a great book. $\endgroup$
    – whuber
    Commented Nov 1, 2019 at 15:13
  • 2
    $\begingroup$ "The Signal and the Noise", an easy non-technical read by Nate Silver, contains many such interesting examples. Including how poor assumptions and failed statistical models contributed to the crash of the U.S. housing market in 2008. $\endgroup$
    – knrumsey
    Commented Nov 1, 2019 at 15:22
  • 2
    $\begingroup$ A "big list" question where there's no limit to correct answers makes this "too broad". $\endgroup$
    – Glen_b
    Commented Nov 2, 2019 at 11:25
  • 3
    $\begingroup$ Not sure if you can make something of it, but I always liked: 30% of automobile fatalities involve drugs or alcohol; and 70% don't involve drugs or alcohol. Therefore, everyone should drive drugged or drunk because it is safer than driving sober by 2:1. $\endgroup$
    – user56395
    Commented Nov 3, 2019 at 4:15

13 Answers 13

17
$\begingroup$

Benford's law:

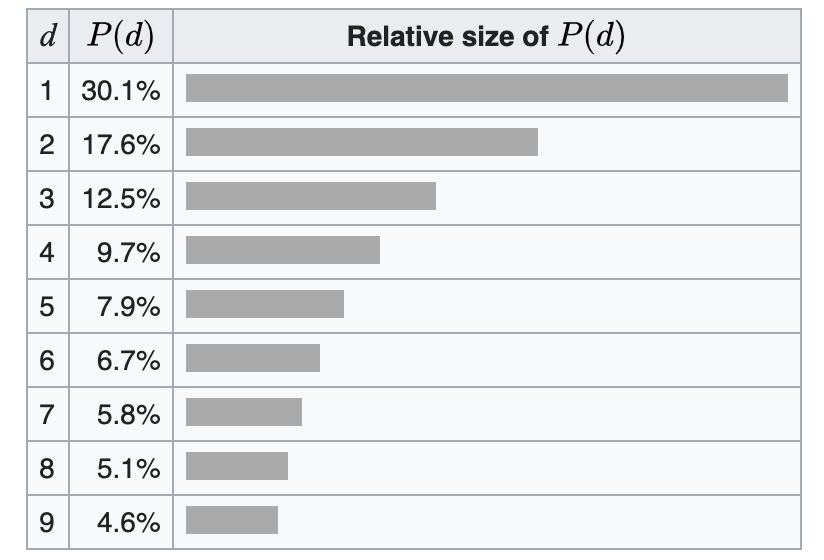
Described here. Digits do not appear with uniform frequency in front of numbers, but rather follow a specific pattern: digit 1 is the most likely to be the first digit, with 30% chance, followed by 2 (17.6% chance), and so on. The following picture (from Wikipedia) shows the frequency of each digit at the beginning of each number, in some naturally-occurring datasets:

Frequency of each digit at the beginning of each number, in some naturally-occurring datasets

There are certain conditions under which the law holds (e.g., the data should span across several scales, so stuff like peoples' heights are not eligible), but it is quite generic.

Perhaps the most surprising application is in fraud detection. This is based on the assumption that people who try to fabricate figures tend to distribute the digits uniformly, thus violating Benford's law.

I recall once I was explaining this to a class, and in the break one of the students came up with an accounting spreadsheet from his company, in which he had tried to validate my claims. It worked :)

Zipf's law

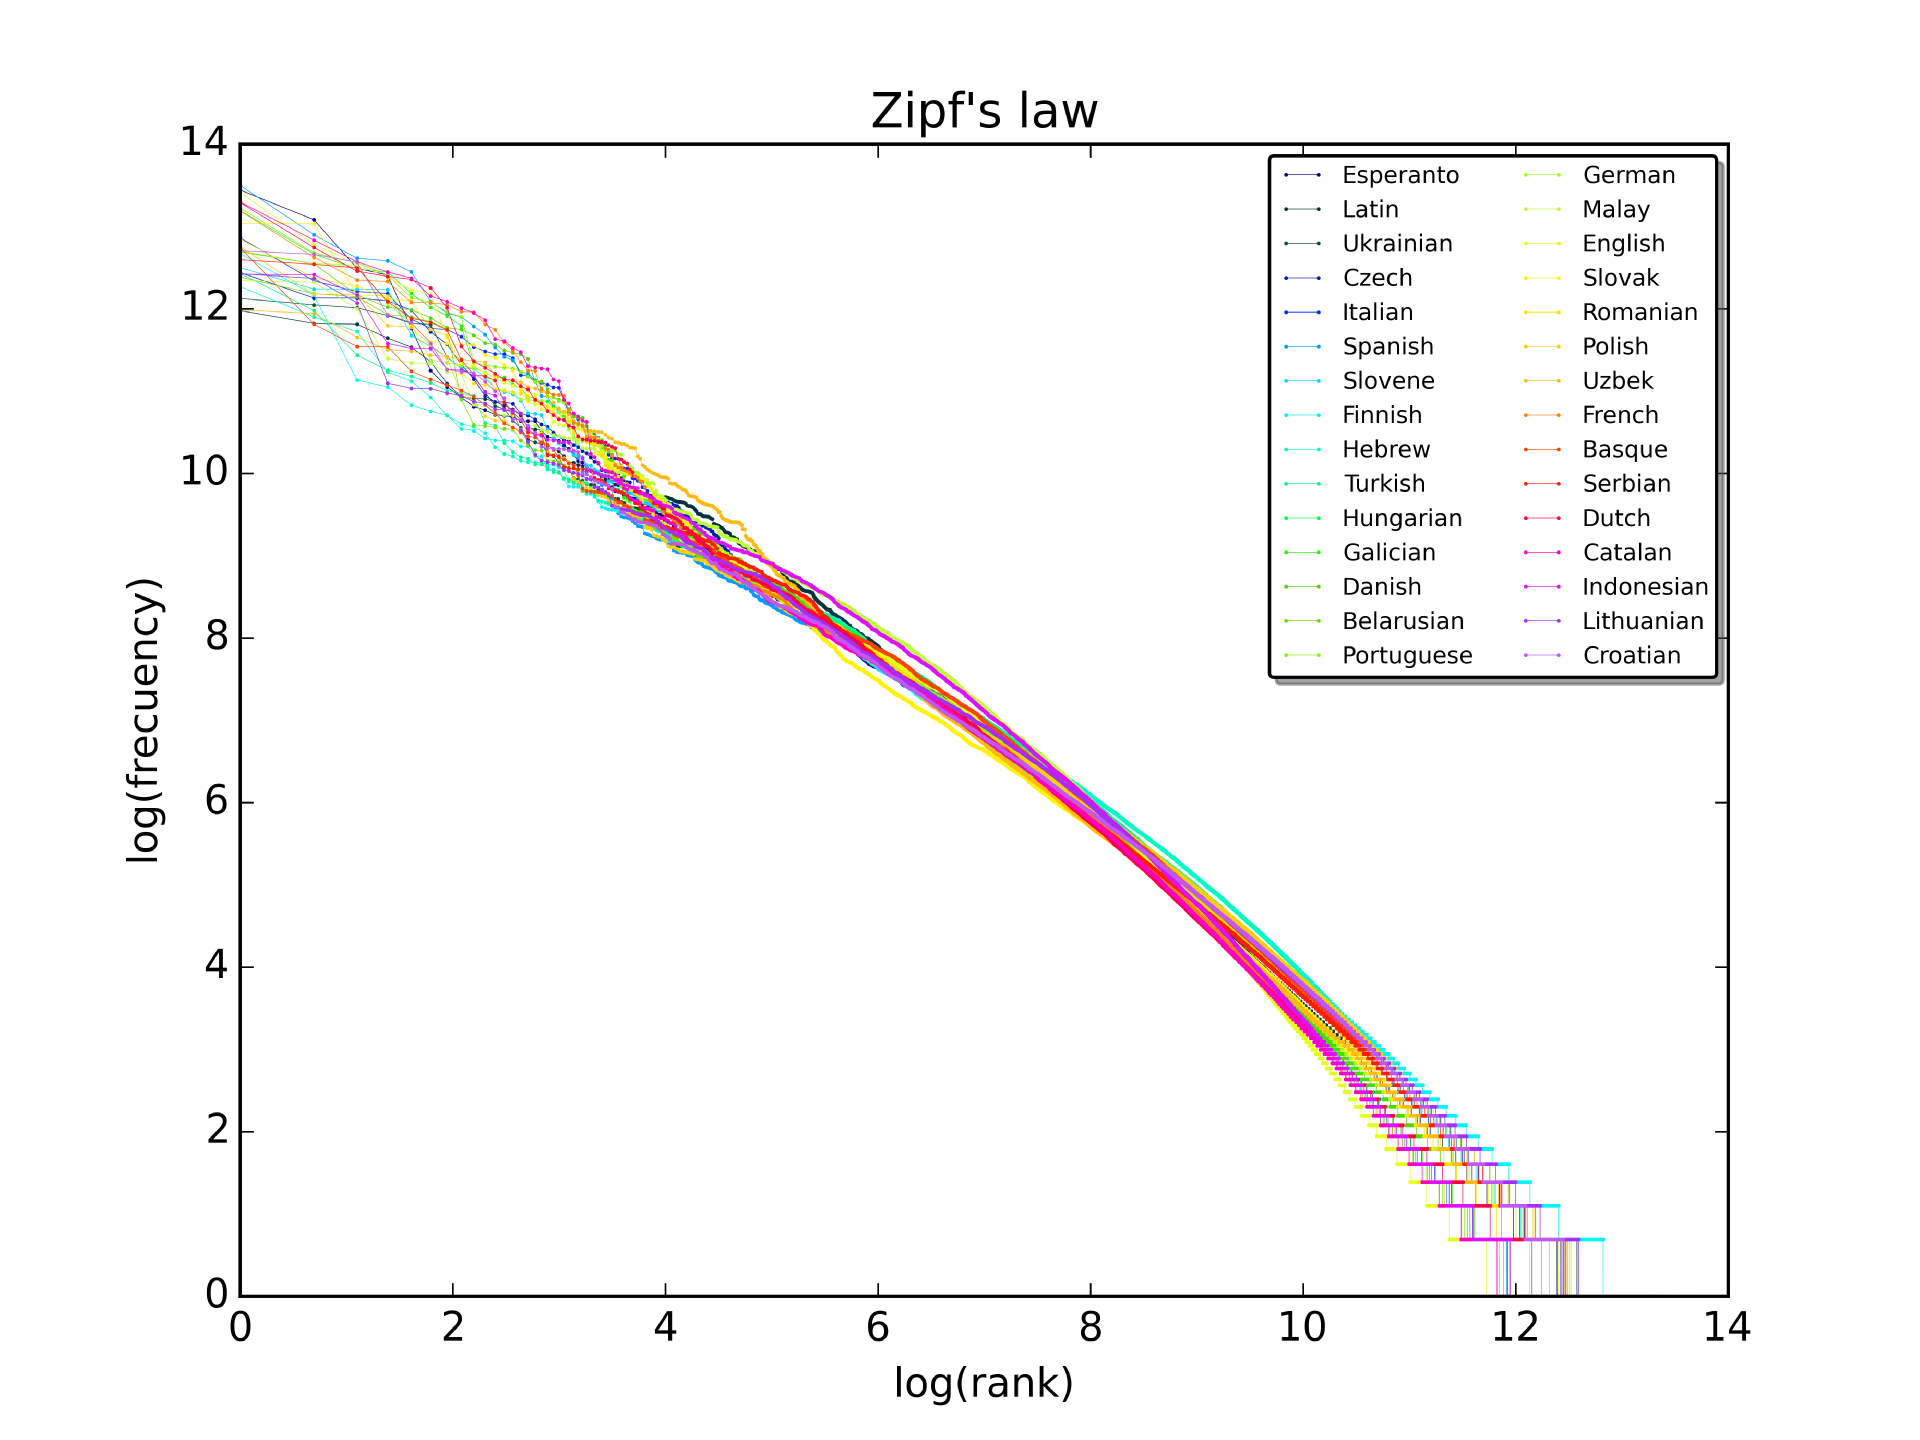
Described here: The frequency of a word in a corpus is inversely proportional to its rank. What is surprising is that this relationship holds for any corpus, even for ancient languages that have not yet been translated. An interesting video explaining more about why this pattern may hold is here. The following picture shows rank (horizontal) vs frequency (vertical) in a log-log scale for the first 10 million words in 30 Wikipedias (source). Note that the law would predict a straight line: Rank vs Frequency

These two laws are powerful and counter-intuitive, and in the sense that they enhance one's understanding of the world via statistics, they could be called "statistical wins".

$\endgroup$
2
  • 3
    $\begingroup$ What does "rank" of a word mean? My first guess is that it means the rank(frequency). If that's the case, the interesting part of this is that the line between these two is so similar, since it is by definition monotonic. $\endgroup$
    – Cliff AB
    Commented Nov 5, 2019 at 1:55
  • 1
    $\begingroup$ Indeed, it is frequency rank (within a specified corpus). The interesting part is that rank predicts frequency so well - the other way around is of course true by definition. $\endgroup$
    – Ioannis
    Commented Nov 5, 2019 at 9:50
47
$\begingroup$

I really liked the German tank problem. It shows, how data which is usually considered as irrelevant becomes valuable information in the hand of a statistician. Furthermore, I liked the law of small numbers and the base rate fallacy.

$\endgroup$
2
  • $\begingroup$ Another common fallacy that's similar to the false positive paradox (aka base rate fallacy) is Simpson's Paradox. It explains why, for instance, the medical procedure with the highest chance of success will often paradoxically have a lower success rate than other options. $\endgroup$ Commented Nov 2, 2019 at 22:38
  • 10
    $\begingroup$ The comma after "shows" is as German as the tanks you're talking about. ;) great example, BTW. $\endgroup$ Commented Nov 3, 2019 at 7:50
36
$\begingroup$

R vs Sally Clark is a famous case of a woman being convicted for murder because the court was unaware of statistics and probability base principles.

But if I have to say the thing that impressed me the most, when I begun studying statistics, that is regression to the mean, which also gave the name to statistical regression (even if that is a completely different thing). The nobel prize winner (for economics, even if he's a psychologist) Daniel Kahneman told a fascinating anecdote about how he realized how regression to the mean can lead people to false beliefs.

Edit: One other very insteresting story that just came to my mind, and concernes importance of missing data instead, is the one of Abraham Wald and war planes bullet holes.

$\endgroup$
4
  • 2
    $\begingroup$ Nice one! Actually the Kahneman point is central to Deming's quality revolution where he criticized "salesman of the month" awards that demoralize workers by rewarding randomness. I'm going to use that for sure. $\endgroup$
    – Placidia
    Commented Nov 1, 2019 at 15:56
  • 1
    $\begingroup$ This case (a nurse convicted for a high rate of death) is similar. stats.stackexchange.com/a/314249/164061 $\endgroup$ Commented Nov 4, 2019 at 11:03
  • 3
    $\begingroup$ The Wald story is a good one for demonstrating the concept of survivorship bias. It can be used as a illuminating exercise too by having the students make the recommendation for where to put extra armor. $\endgroup$
    – JimmyJames
    Commented Nov 4, 2019 at 15:32
  • $\begingroup$ See law.stackexchange.com/questions/83781/… $\endgroup$ Commented Aug 30, 2022 at 18:31
32
$\begingroup$

To illustrate where ordinary intuition fails, the Monty Hall paradox is a great starter.

$\endgroup$
1
  • $\begingroup$ But is this a "statistical win" or "statistical fail"? $\endgroup$
    – user103496
    Commented Oct 17, 2023 at 4:24
26
$\begingroup$

If sampling is a part of your course then it's hard to beat Dewey beats Truman

$\endgroup$
1
  • 1
    $\begingroup$ I forgot that one. Thanks. $\endgroup$
    – Placidia
    Commented Nov 1, 2019 at 14:18
20
$\begingroup$

I find the false positive paradox remarkable because it is so counter-intuitive. A good example:

Cancer screening of the general population does not increase life expectancy, even though clearly lives are saved because some cancers are caught early and can be treated better. The U.S. Preventive Services Task Force accordingly stopped recommending routine screening for women aged 40-49 in 2009.

This is good teaching material because it is a non-trivial real-life example which concerns almost everybody at some point in their lives. There is an article by the National Cancer Institute here.

The reasoning goes thus:

  • The number of cancer incidents is small so that the "number needed to treat" (read: screen) is large.
  • The tests are fairly reliable. But the low incidence rate leads to a large absolute false positive number with the consequence of a large number of unnecessary biopsies (>90% are false positives).
  • Cancer incidents fall in one of the following subsets:
    1. Aggressive cancers which will kill the patient no matter what.
    2. Slow cancers which will not kill the patient before they die of other causes. Detecting these is called overdiagnosis. From the USPSTF document: "Even with the conservative estimate of 1 in 8 breast cancer cases being overdiagnosed, for every woman who avoids a death from breast cancer through screening, 2 to 3 women will be treated unnecessarily."
    3. Cancers which will be treatable even when detected late, without screening.
    4. Cancers which are aggressive enough to kill the patient when detected late but are still treatable when detected early.

Only class 4 profits from screening, at the expense of large numbers of unnecessary hospital visits, unnecessary biopsies and a lot of sleepless nights. All of these are small but measurable health risks which accumulate over the large number needed to treat, outweighing the very real benefit for the small number in subset 4.

$\endgroup$
3
  • $\begingroup$ Is mammography in the general pop above 40 or above 50 a clear example of this? Very small increase in risk of breast cancer from x-ray exposure multiplied across a very large number of mammograms = an offset to the prevention wrought by early detection of your #4 type breast cancers. $\endgroup$
    – Alexis
    Commented Nov 5, 2019 at 22:15
  • 2
    $\begingroup$ @Alexis Yes, it is. I linked an article by the USPSTF which is quite illuminating. They stopped recommending routine screening for younger women. For women aged 50-60 there is a 60% chance for a false positive over 10 years, and still a 9.4% chance for an unnecessary biopsy. (And note that the "true positives" still include all 4 of my subsets, i.e. a significant number was overdiagnosed or deadly anyway. ) $\endgroup$ Commented Nov 6, 2019 at 8:09
  • 2
    $\begingroup$ @Alexis And I would not underestimate the other risks connected to simple hospital visits, let alone biopsies. With multiple resistant strains any invasive procedure is a significant risk. The harm done through the mis- or overdiagnosis alone (without any treatment!) is also significant. People are usually besides themselves when diagnosed with cancer, don't sleep well, don't eat well, with whatever side effects (physiological, accidents, substance abuse). It's all fairly small but for large numbers. $\endgroup$ Commented Nov 6, 2019 at 8:20
16
$\begingroup$

Another interesting case as to how wrong gambling can go is the Monte Carlo Casino example.

In a game of roulette at the Monte Carlo Casino on August 18, 1913 the ball fell in black 26 times in a row. This was an extremely uncommon occurrence: the probability of a sequence of either red or black occurring 26 times in a row is around 1 in 66.6 million, assuming the mechanism is unbiased. At that time, Gamblers lost millions of francs betting against black, reasoning incorrectly that the streak was causing an imbalance in the randomness of the wheel, and that it had to be followed by a long streak of red.

Gambler's fallacy and Gambler's ruin give a good explanation for this example.

$\endgroup$
7
  • 1
    $\begingroup$ Was the wheel rigged? Is there any more discussion of this story in the statistical literature? $\endgroup$
    – innisfree
    Commented Nov 4, 2019 at 7:01
  • $\begingroup$ @innisfree to my knowledge, it was not $\endgroup$ Commented Nov 5, 2019 at 1:09
  • 2
    $\begingroup$ Given the amount of roulette that gets played worldwide, such a coincidence occurring somewhere, somewhen is in fact quite plausible; it's expected to happen approximately once per 66.6 million opportunities. But the odds are highly against it occurring at your particular table on a night you're playing. $\endgroup$
    – Chromatix
    Commented Nov 5, 2019 at 1:38
  • $\begingroup$ @Chromatix absolutely right. Just remember a case study of a man who got struck by a lighting 7 times during his lifetime. Also a very improbable event, but it was not surprising that it happened over the entire course of history $\endgroup$ Commented Nov 5, 2019 at 1:45
  • 1
    $\begingroup$ It's also quite plausible that crooks in the early twentieth century rigged a roulette wheel in a casino ;) $\endgroup$
    – innisfree
    Commented Nov 5, 2019 at 2:06
8
$\begingroup$

I don't know if this counts as "intuition falls short", but rather a "naive analysis gives a counter intuitive, and misleading, answer".

One of my stats professors introduced a study regarding the connection between smoking and FEV in young students.

FEV can be considered to be a measure of lung volume. When the professor first introduced the data, he asked what we thought the relation would be. We all thought that smoking would be linked to lower FEV. However, looking at the data, that was not true! In fact, smokers had larger FEV's than non-smokers. Was this class being taught by a smoking-denialist?

Then, he reanalyzed the data, but this time adjusting for age. With this was done, we saw what we expected to see: a negative impact of smoking on FEV. This was because smokers were much more likely to be older students than younger students. While smoking did have a negative impact on their FEV, it was not so much that it completely eliminated the increase in FEV from growing up.

A link to a walk through of the data in R can be found here.

$\endgroup$
1
  • $\begingroup$ +1 for adding a link to the data. Nice example of a confounder! $\endgroup$
    – Placidia
    Commented Nov 4, 2019 at 13:35
7
$\begingroup$

My favourite example, as an illustration of how faulty statistics can have long-term consequences when they are used to direct government policy, is the act of large-scale railway vandalism known as the Beeching Axe. It resulted from a Transport Minister with strong ties to the road-building industry (Ernest Marples) hiring a petrochemicals-industry expert (Richard Beeching) to determine which parts of the British railway network were making losses and should therefore be pruned.

About 4000 route miles were closed as a direct result, with a direct positive effect on demand for roads (and, inevitably, much of today's congestion). Further closures continued into the 1980s, including the important and relatively recently upgraded Woodhead route across the Pennines, and halting only with the case of the Settle & Carlisle line, which had once been the northern section of the Midland Railway's main line.

It is perhaps noteworthy that Marples subsequently fled the country to evade prosecution for tax fraud. Suspicions of conflicts-of-interest were also held at the time, as he had sold his 80% stake in his former road-building form Marples Ridgeway (as legally required by his ministerial appointment) to his wife, thus making it easy for him to reacquire them subsequently.

One good source on the subject is "I Tried to Run a Railway" by Gerard Fiennes.

The statistical errors involved here were largely down to taking an excessively narrow view of the problem. Branch lines' stations were visited to examine their receipts and take surveys of traffic - but seasonal traffic which used the line and whose tickets were sold elsewhere in the country was ignored. In many cases costs were inflated by obsolete working practices which could have been streamlined, but this option was not considered at the point of choosing which lines would be closed entirely. This also led to some lines whose losses were only slight, and which indirectly benefited the railways as a whole through the "network effect" of being able to reach destinations without a change of mode, being included on the closure list.

These errors were repeated in the later Serpell Report which proposed an even more drastic closure program, but which was fortunately rejected.

Today, railway traffic demand is rising sharply in Britain, and lines are being newly built and reopened to meet demand. Some lines closed by Beeching and Marples' efforts would be highly beneficial if they still existed today.

$\endgroup$
2
  • 1
    $\begingroup$ The story of the later privatisaton of the railways is also interesting as an example of erroneous thinking. Chapter 2 of Private Island is an excellent account of it. versobooks.com/books/1731-private-island $\endgroup$
    – James
    Commented Nov 4, 2019 at 14:29
  • 1
    $\begingroup$ I don't quite understand what if any statistical errors were committed here? Seems like the only error was incorrectly counting the costs and benefits? $\endgroup$
    – user103496
    Commented Oct 17, 2023 at 4:30
5
$\begingroup$

Nice QA! here my two cents: It is mainly about how correlation can be very suspicious and some traditional ways to work it out:

https://www.tylervigen.com/spurious-correlations

https://en.wikipedia.org/wiki/Anscombe%27s_quartet

https://en.wikipedia.org/wiki/Spearman%27s_rank_correlation_coefficient

To elaborate a little, the canon for correlation vs. causation in modern statistics is certainly Judea Perl. Nielsen's (web)book provides a good review:

http://www.michaelnielsen.org/ddi/if-correlation-doesnt-imply-causation-then-what-does/

$\endgroup$
1
  • $\begingroup$ I remember a statistics book using stork sightings vs birthrate to make the point that correlation doesn't necessarily prove causation. $\endgroup$
    – MaxW
    Commented Nov 4, 2019 at 21:00
3
$\begingroup$

The failure to show the association between launch temperature, and the effect of launch temperature, on the space shuttle o-rings, leading to the catastrophic failure of the Columbia soon after launch. An overview of the problem is here.

$\endgroup$
2
  • 3
    $\begingroup$ For what it's worth, the link you provided doesn't quite capture what happened. In fact, the engineers recognized the issue in advance, but managers ignored their concerns. $\endgroup$
    – Cliff AB
    Commented Nov 4, 2019 at 19:39
  • 2
    $\begingroup$ Quoting from same Wikipedia page: "When a Thiokol manager asked Ebeling about the possibility of a launch at 18 °F (−8 °C), he answered "[W]e're only qualified to 40° [40 °F or 4 °C] ... what business does anyone even have thinking about 18°, we're in no-man's land.'" $\endgroup$
    – Cliff AB
    Commented Nov 4, 2019 at 19:43
0
$\begingroup$

Some accounts that came up from my grad-school profs:

$\endgroup$
-1
$\begingroup$

For the last year and a half Bloomberg News has made periodic estimates of Tesla 3 production using multiple data sources. They just terminated this work but I think the history is interesting.

$\endgroup$

Your Answer

By clicking “Post Your Answer”, you agree to our terms of service and acknowledge you have read our privacy policy.

Not the answer you're looking for? Browse other questions tagged or ask your own question.