1
$\begingroup$

I am attempting to forecast percentage of churn. However, I am running into issues. The churn is fairly stable except at each year anniversary point.

For example, data looks like this for the first year

Month 9: 1.013770726
Month 10: 1.013770726
Month 11: 1.015761766
Month 12: 0.72113357            #big drop in first year

The next year looks fairly stable except the 2nd anniversary point:

Month 21: 0.7765050878
Month 22: 0.7844692491
Month 23: 0.7884513297
Month 24: 0.4732490503

I thought about simple exponential smoothing model or a simple weighted average. That will help me with normal months but not the expected large drop each year point.

I also tried an arima. That helped with the seasonal drop but well under-forecasted all the other months.

Is there an another option that is obvious that I am not considering?

Here is the completed data set

month   churn
2016-09-01  0.9854712144
2016-10-01  1.000828964
2016-11-01  1.000828964
2016-12-01  1.000828964
2017-01-01  1.004811044
2017-02-01  1.006802085
2017-03-01  1.006802085
2017-04-01  1.009788645
2017-05-01  1.009788645
2017-06-01  1.013770726
2017-07-01  1.013770726
2017-08-01  1.015761766
2017-09-01  0.72113357
2017-10-01  0.7300932514
2017-11-01  0.7346932411
2017-12-01  0.7406663621
2018-01-01  0.7565946846
2018-02-01  0.7585857249
2018-03-01  0.7625678056
2018-04-01  0.7685409265
2018-05-01  0.7725230072
2018-06-01  0.7765050878
2018-07-01  0.7844692491
2018-08-01  0.7884513297
2018-09-01  0.4732490503
2018-10-01  0.4890469254
$\endgroup$
2
  • $\begingroup$ There are seasonal exponential smoothing models. Have you tried an automatic model selection algorithm like ets() in the forecast package for R? It might make sense to work on logged data, given that your data are percentages, i.e., multiplicative. It would be good if you could post a complete time series you want to forecast, not just a few months. $\endgroup$ Commented Nov 6, 2019 at 17:37
  • $\begingroup$ @S.Kolassa-ReinstateMonica thanks. Posted the entire time series. I am working in python at moment but can switch to R if they have better packages for this $\endgroup$ Commented Nov 6, 2019 at 17:51

1 Answer 1

1
$\begingroup$

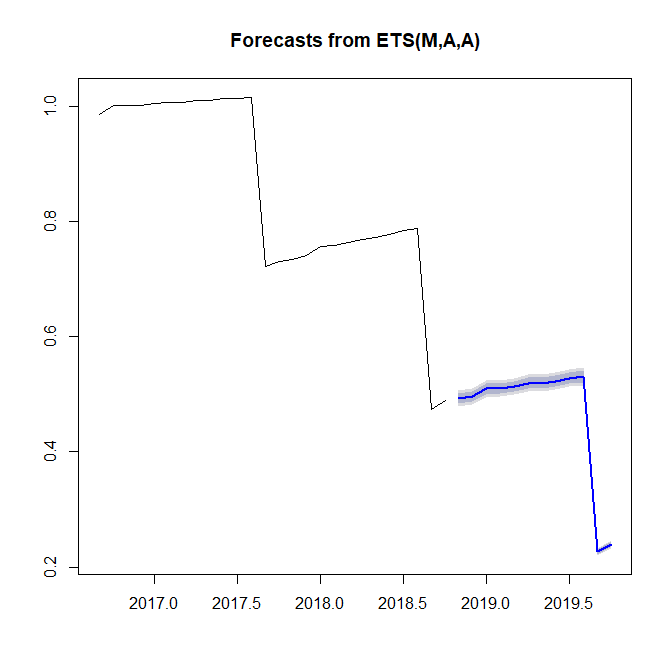
R has very good facilities for automatic time series forecasting, which I very much recommend. Here is what R does with your data, specifically an exponential smoothing model in state space form (ETS for "Error, Trend, Seasonality"):

library(forecast)

churn <- structure(c(0.9854712144, 1.000828964, 1.000828964, 1.000828964, 
1.004811044, 1.006802085, 1.006802085, 1.009788645, 1.009788645, 
1.013770726, 1.013770726, 1.015761766, 0.72113357, 0.7300932514, 
0.7346932411, 0.7406663621, 0.7565946846, 0.7585857249, 0.7625678056, 
0.7685409265, 0.7725230072, 0.7765050878, 0.7844692491, 0.7884513297, 
0.4732490503, 0.4890469254), .Tsp = c(2016.66666666667, 2018.75, 
12), class = "ts")

model_ets <- ets(churn)
plot(forecast(model_ets,h=12))

churn forecast

You get very reasonable point forecasts for the next 12 months, along with prediction intervals. You can also inspect the fitted model by typing model_ets. The title of the plot already tells you that you have an exponential smoothing model with multiplicative error, additive trend and additive seasonality. Makes sense to me. You could also allow ets() to automatically fit a Box-Cox transformation via ets(churn,lambda="auto").

However, the forecasts start looking weird once you forecast out 24 months (whether or not you use an automatic Box-Cox transformation) - they go below zero. So you may want to work on logged data here. It should in principle be possible to do so by using the parameters lambda=0,biasadj=TRUE in the call to ets(), but then ets() does not want to fit seasonality any more, and if you force seasonality by also specifying model="ZZA", you still get strange forecasts (specifically, they are offset from the last observation, which I don't fully understand), so you may want to log the data first, then feed them to ets(). Note that you need a bias transformation (look under "mathematical transformations" here) to get expectation forecasts.

An alternative is to use auto.arima(), but that one gives warnings generated by the unit root test because you have a rather short time series. If you have fewer than two seasonal cycles, ARIMA is a bit dubious, so I would stick with the simpler ETS models.

I very much recommend Forecasting: Principles and Practice by Hyndman & Athanasopoulos (2nd ed.), which is freely available online here. It uses R throughout.

$\endgroup$
3
  • $\begingroup$ Providing a full reference for the textbook would make your answer more transparent and robust against the link potentially going dead in the future. $\endgroup$ Commented Nov 6, 2019 at 18:45
  • $\begingroup$ @RichardHardy: I see your point, but to be quite honest, in this specific case I am rather relaxed. I know Rob Hyndman, who is both the author of the book and behind otexts.com. Stuff he is responsible for will not simply go away. But I'll edit my answer. $\endgroup$ Commented Nov 6, 2019 at 18:49
  • $\begingroup$ Thank you. The edit at least helps transparency: one does not need to click on the link to figure out what is what. (And with all due respect to Rob Hyndman, I have witnessed links called "permanent" going dead in the past, so why take chances.) $\endgroup$ Commented Nov 6, 2019 at 19:29

Your Answer

By clicking “Post Your Answer”, you agree to our terms of service and acknowledge you have read our privacy policy.

Not the answer you're looking for? Browse other questions tagged or ask your own question.