2
$\begingroup$

I have 4 groups that are not normally distributed. I would like to know if they are significantly different, with the aim of knowing if they would make a good feature to base a classification on.

I've made box&whisker plots and by looking at them, just by intuition, I feel that they are similar, statistically. That is not very satisfying though and probably not a good way to pass judgment, so I want a way to quantify this. I have been using the Kruskal Wallis test on the groups. Because of the unbalanced group sizes, I don't trust the results. The size of the samples is: 4756, 4018, 1116 and 171. I'm currently getting a p-value of 0.000104, and an H of 21.02

Is there a rule of thumb to follow to know when it is appropriate to test groups with different sizes? I really feel it is unfair to compare a group of 171 to 4756 - that this imbalance should make the comparison invalid. Is the 'solution' to simply say there is not enough data to make a comparison, and wait till more is taken? At what point then would there be 'enough' data or the point when the groups are similar enough size?

$\endgroup$
1
  • 1
    $\begingroup$ It is inefficient to design an experiment so that you're comparing one group with 171 observations and another with 4756, but not wrong. Inefficient because the power of the test will depend more of the smaller group than on the larger. If you had resources to make about 5000 observations, you would have best power with about 2500 in each group. // Some nonparametric tests behave badly when one of the groups is very small, but you are nowhere near that problem with 171. $\endgroup$
    – BruceET
    Commented Nov 22, 2019 at 7:34

1 Answer 1

1
$\begingroup$

Comment continued: Notice that the small sample inmmy first example is very much smaller than you are suggesting in your Question.

Demonstration of K-W test where one level has very small sample size.

With sample sizes 4, 200, 100, and a difference of 15 between population group means, the K-W test does not give a significant result

set.seed(1121)
x1 = rnorm(4, 95, 10)
x2 = rnorm(200, 110, 10)
x3 = rnorm(100, 110, 10)
x = c(x1,x2,x3)
g = rep(1:3, times=c(4,200,100))
kruskal.test(x ~ g)

        Kruskal-Wallis rank sum test

data:  x by g
Kruskal-Wallis chi-squared = 5.2646, df = 2,  
 p-value = 0.07191

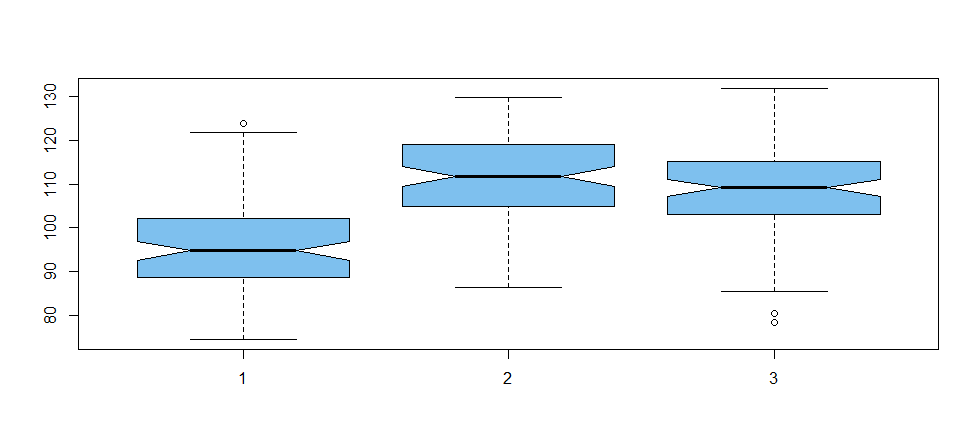
In a similar situation with 100 observations at each level, the difference is found to be very highly significant.

set.seed(1122)
x1 = rnorm(100, 95, 10)
x2 = rnorm(100, 110, 10)
x3 = rnorm(100, 110, 10)
x = c(x1,x2,x3)
g = rep(1:3, each=100)
kruskal.test(x ~ g)

        Kruskal-Wallis rank sum test

data:  x by g
Kruskal-Wallis chi-squared = 97.804, df = 2, 
 p-value < 2.2e-16

Notches in the boxplots below are nonparametric confidence intervals calibrated so that, roughly speaking, non-overlapping CIs suggest a difference in location between two levels. (In the first example, it would be problematic to make a boxplot with only 4 observations at the first level.)

boxplot(x ~ g, col="skyblue2", notch=T)

enter image description here

$\endgroup$

Your Answer

By clicking “Post Your Answer”, you agree to our terms of service and acknowledge you have read our privacy policy.

Not the answer you're looking for? Browse other questions tagged or ask your own question.