This might be already asked and answered. However, all the questions and answers for possible similar questions are too high level for me.
So, I will generate a very simple example and please, do not go crazy in statistics or math. I am pretty sure this can be answered using plain terms and using excel functions.
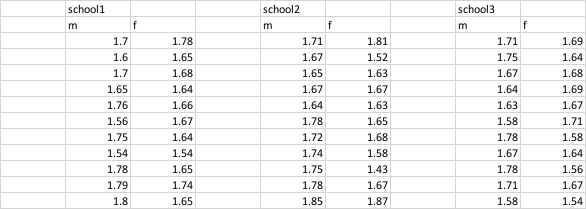
Lets compare how tall are boys and girls. We go to a school and pick 10 boys and 10 girls. Then we repeat the process in school2 and school3.
So we have three sets of data. m is male, f is female. The numbers is how tall are they in meters.
Then we can use excl functions to calculate mean (=average) and standard desviation:

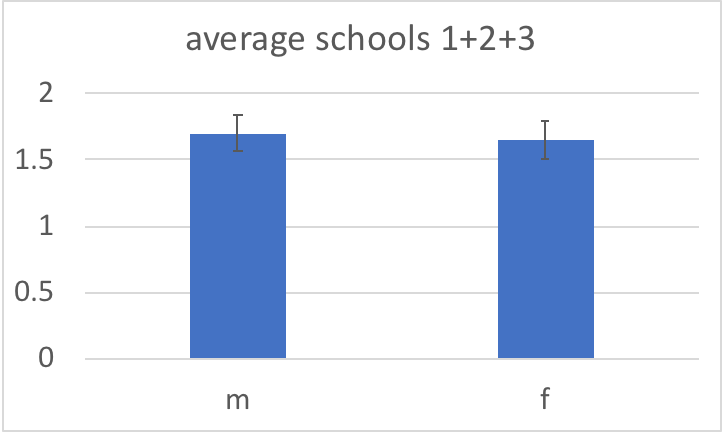
Even we can plot it. The error bars are the standard desviation value. Not sure if I should put only the bar going up or both up+down.

Now, lets try to combine the three sets of data:

My question is... How I calculate the standard desviation (or should be the standard error)? If you can help to answer (without math) just the concept and how to get it in excel it would be very helpful.
Thanks
Edit:
From Peter Flom - Reinstate Monica♦ answer I understood:
 Where the standard desviations of the combined graph are calculated as:
STD = SQRT( (std1^2) + (std2^2) + (std3^2) )
SQRT is EXCEL function for square root. std1, 2, 3 are the standard desviation for school 1 ,2,3 respectively. ^ is the power symbol in excel.


