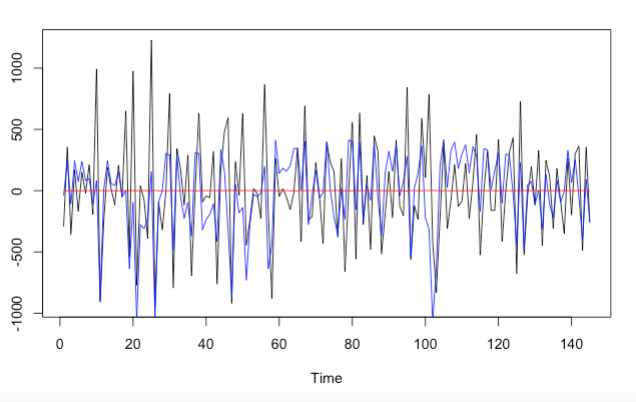
You asked "Is it a general thing that an ARIMA(0,0,0) becomes a MA(1) when the series is differenced?"
Yes if the differencing is unwarranted ... as in this example where Y(t) is a white noise series.
If Y(t)=A(t) and you difference Y you get
[1-B]Y(t)= A(t)[1-1.0B] where B is the backshift operator.
thus you have injected structure by differencing and the arima model (0,1,1)(0,0,0) essentially reverses/cancels the unwarranted differencing.
This is true for all underlying arima processes not just white noise and for all forms of differencing including seasonal differencing . If the series is seasonally differenced times ... this would inject (0,0,0)(0,1,1) .
EDITED AFTER RECEIPT OF DATA:
You might want to start How to predict how the time series behaves in the future? and look at my comments on a taxonomy of forecasting models as it discusses deterministic structure and memory (arima) structure .
How to evaluate deterministic vs stochastic components of a time series? discusses deterministic structure ( often based upon ) anthropomorphic effects and stochastic (memory effects reflecting unspecified predictors)
Determining what combination is sufficient for your data requires evaluating possible alternatives.
Your data 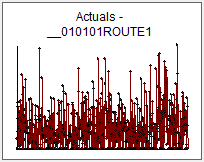 and
and 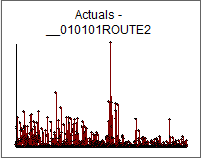 and
and 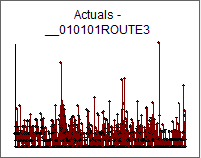 and
and 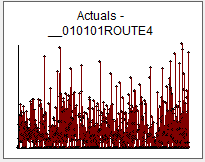 and
and 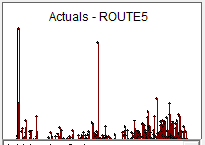 have a large amount of “missing values” or zeroes which creates additional problems/opportunities for typical time series identification tools.
Your 5 data sets do not require/suggest any form of required differencing and any tool that you are using to suggest that has simply ignored possible fixed effects ( pulses,seasonal dummies , level/step shifts (see ROUTE2 ) .
Suggestions regarding needed differencing are arithmetic artifacts.
Non-stationarity is a symptom with many possible causes and is not always remedied by differencing . For example your ROUTE1 data AND ROUTE2 suggests a seasonal pulse as a possible “cause” of the non-stationarity. I suggest you look closely at the assumptions underlying KPSS by pursuing some of these threads https://stats.stackexchange.com/search?q=problems+with+KPSS
When neither latent deterministic structure or ARIMA structure appear to be of limited value , one might strongly pursue the explicit incorporation of user-suggested causal variables …think rainfall , or price or demographic variables or possible holiday effects if this data is anthropomorphic.
Here is a quick study of ROUTE2 with forecasts for 90 days. 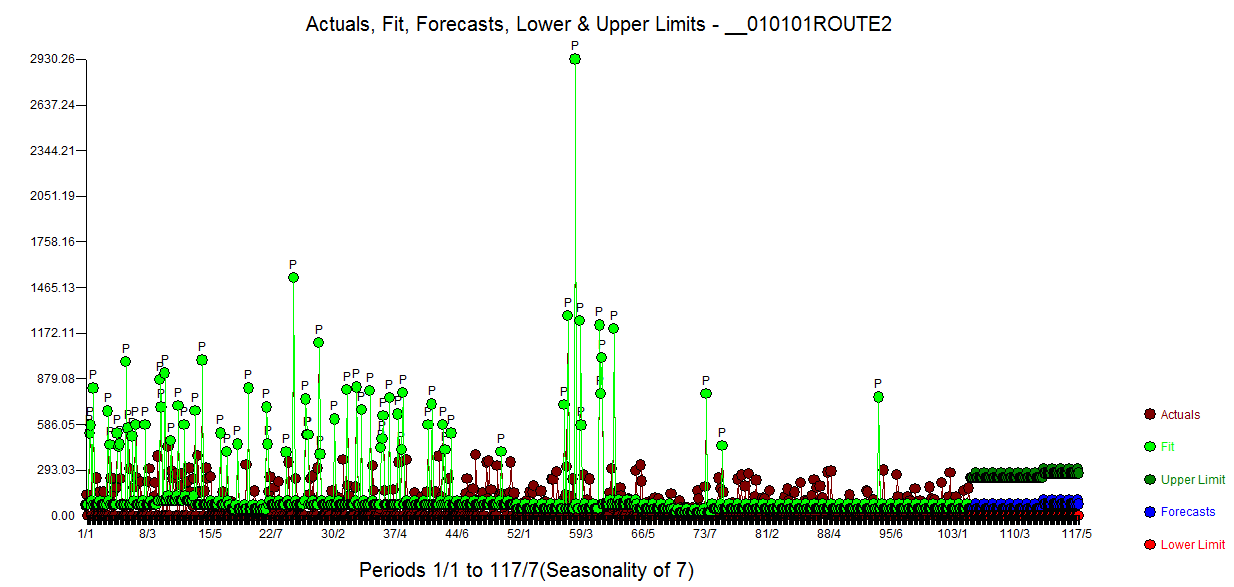 based upon this possibly useful equation
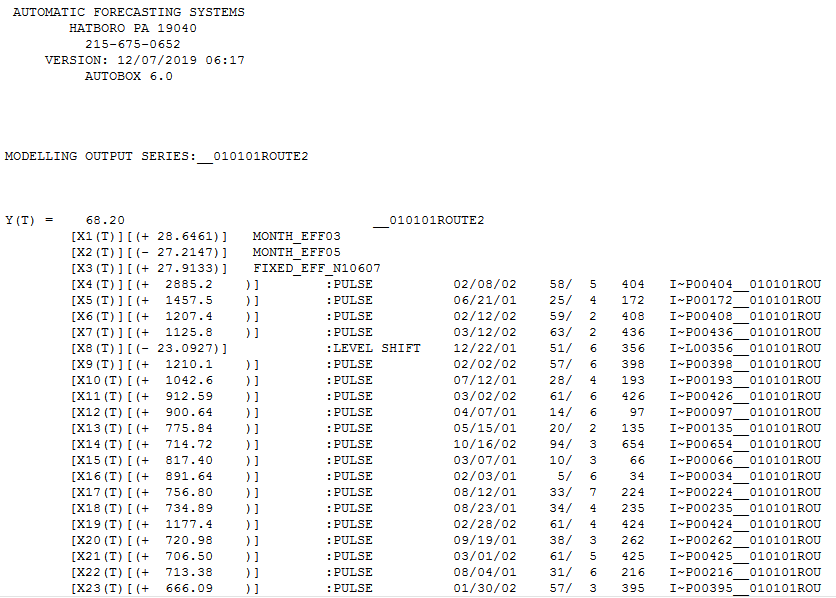 ... the level shift and the seasonal pulses could easily be the cause for the incorrect suggestion/need to difference.

