0
$\begingroup$

I am trying to find the correct ARIMA model for a time series without seasonality that produce the following ACF and PACF plots.enter image description here
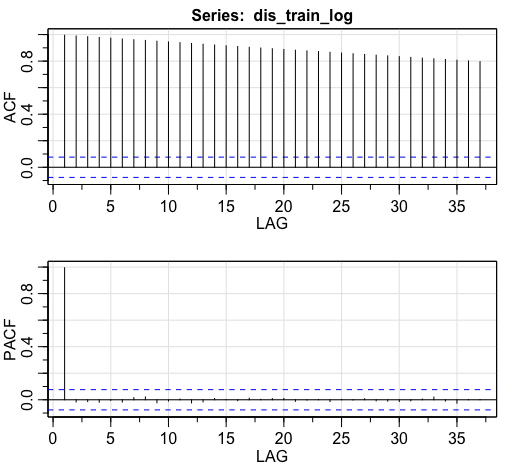
Looking at these plots my initial hypothesis is that an ARIMA(1,0,0) model is required due to the PACF dropping to 0 after lag 1, but the ACF is decaying too slowly for me to be sure about it.

$\endgroup$
3
  • $\begingroup$ My guess would be (0,1,0) BUT only your data knows for sure as the apparent ACF could reflect latent deterministic structure . Post your actual data and I will try and help further. $\endgroup$
    – IrishStat
    Commented Jan 14, 2020 at 11:12
  • $\begingroup$ My data is the monthly Disney stock prices taken from Yahoo Finance $\endgroup$
    – Pedro Unas
    Commented Jan 14, 2020 at 11:29
  • $\begingroup$ most probably (0,1,0) $\endgroup$
    – IrishStat
    Commented Jan 14, 2020 at 11:33

1 Answer 1

1
$\begingroup$

most probably (0,1,0) as stock prices are usually random walk models.

$\endgroup$
1
  • $\begingroup$ That makes sense, thank you for your help! $\endgroup$
    – Pedro Unas
    Commented Jan 14, 2020 at 11:40

Your Answer

By clicking “Post Your Answer”, you agree to our terms of service and acknowledge you have read our privacy policy.

Not the answer you're looking for? Browse other questions tagged or ask your own question.