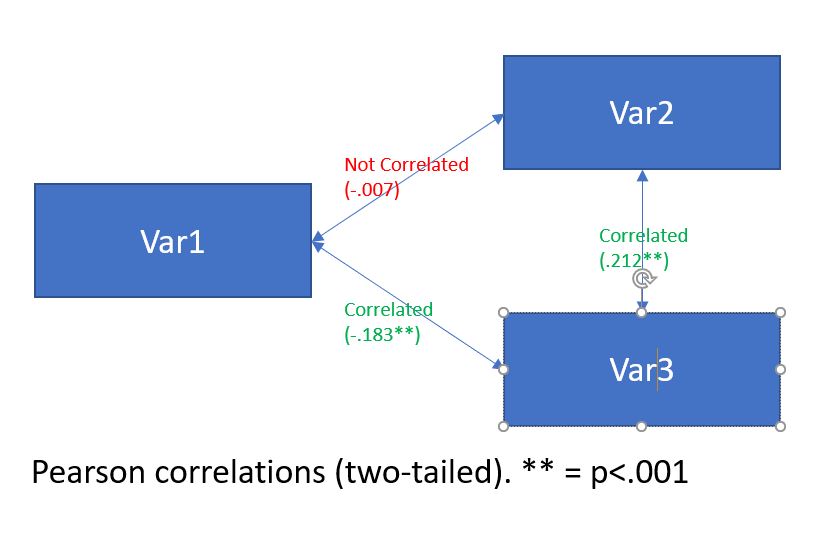
A correlation expresses an association between two variables. One can find the variance that's shared between two variables by squaring the correlation coefficient (e.g., shared variance = $r^2$.) So, the shared variance between variable 1 and 3 in your diagram is 0.033, and the shared variance between variable 3 and 2 is 0.045. That means, there's 1-0.033 (.967) of the variance in variables 1 and 3 left unexplained by their relationship, and 1-0.045 (0.955) of the variance in variables 2 and 3 left unexplained by their relationship. Given the tiny components of explained variance, it's very possible that there is no overlap between variables 1 and 2, they're independent.
Let me give you a real-world example. Let's say people who love iPhones also love Wired Magazine. And, people who love Android phones love Wired magazine. However, people who love iPhones don't necessarily love Android phones (some do, some don't.) There doesn't have to be a relationship between two variables for them to both prove helpful in predicting another variable. They can each explain part of the variance.
Basil also presents an excellent plain-english explanation in this thread: If A and B are correlated with C, why are A and B not necessarily correlated?

