0
$\begingroup$

I'm trying to model a process in which a success is the generation of $2$ items. If I model the process using a binomial random variable with p equal to the probability of success, I can compute the parameters for a binomial distribution.

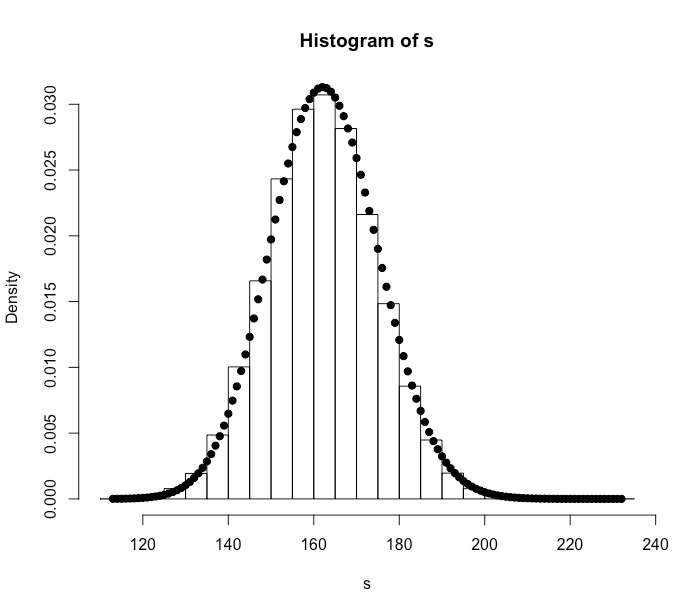
For example, if I generate a $100000$ instances of a binomial random variable with $250000$ trials and probability of success $0.00065$:

s = rbinom(100000,250000,p2)
hist(s, breaks=30,freq=FALSE)
sapply(min(s):max(s), function(q) { 
  points(q,dbinom(q,250000,p2),pch=19)})

Histogram of binomial random variable

This gives the the number of successes, but I want to also model the number of observations which is $2$ times the number of successes. I assumed I could multiple $p$ times $2$, but that clearly isn't right. That translates to twice the probability of observing a success, and not the actual number of observations.

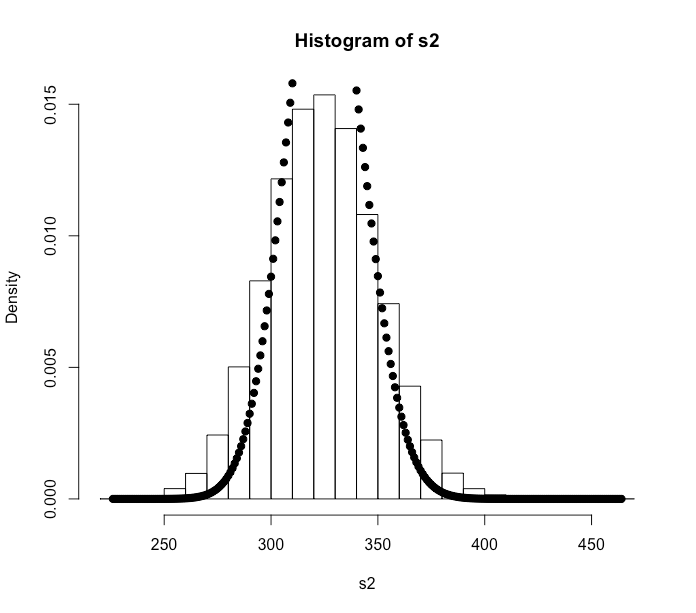
s2 = 2*s
hist(s2, breaks=30,freq=FALSE)
sapply(min(s2):max(s2), function(q) { 
  +   points(q,dbinom(q,250000,2*p2),pch=19)})

Distribution of 2 times binomial random variable

The mean is correct in that it has just shifted upward by a factor of $2$, but the variance is wrong. Analytically, I would have expected the variance to be $4np(1-p)$, but that doesn't appear to be the case here.

What am I missing?

$\endgroup$

1 Answer 1

2
$\begingroup$

If $Y=X$, where $X$ is a binomial distribution. Notice that $Y=2X$ is not a binomial distribution.

In particular, $Y$ always take even numbers.

Its expected value is indeed $2np$ and its variance is $4np(1-p)$ but it does not follow any binomial distribution.

Remark: From the first sentence, I am not sure if $2X$ is what you are interested, if a success is based on two pair of events with sucess probability $p$ independently and there are $n$ such pairs, then perhaps you are interested in $Bin(n, p^2)$.

Edit:

You use the $Bin(n, 2p)$ which has variance $n(2p)(1-2p)=2np-4np^2 < 4np-4np^2$

$\endgroup$
6
  • $\begingroup$ True, this is not a proper Binomial distribution. Could it not be approximated by one, however, assuming the right parameters? I would have expected my second plot to at least approximate the shape, but it appears that the variance is too small. $\endgroup$
    – KirkD_CO
    Commented Mar 21, 2020 at 17:23
  • $\begingroup$ See the edit to show why is your variance smaller. $\endgroup$ Commented Mar 21, 2020 at 17:28
  • $\begingroup$ Regarding Bin(n,p^2), I think this is taken care of in the definition of a success in the original trials. p is the probability that two events have occurred simultaneously already. The probability of any single event would be sqrt(p), correct? $\endgroup$
    – KirkD_CO
    Commented Mar 21, 2020 at 17:31
  • $\begingroup$ If the success probability of each sub event is $\sqrt{p}$. Sure. But yup, you shouldn't end up with $2p$. $\endgroup$ Commented Mar 21, 2020 at 17:33
  • $\begingroup$ Thank you for the explanation regarding why the variance is smaller in my plots. That is tremendously helpful! Another option is to approximate it with a normal distribution. If I use the mean = $2np$ and variance = $4np(1-p), I get what appears to be a good approximation. The same problem holds that this is not really a normal distribution since only even values are present. $\endgroup$
    – KirkD_CO
    Commented Mar 21, 2020 at 17:35

Your Answer

By clicking “Post Your Answer”, you agree to our terms of service and acknowledge you have read our privacy policy.

Not the answer you're looking for? Browse other questions tagged or ask your own question.