2
$\begingroup$

I am working on a research project to identify the individual impact of dominant personalities, and sexual esteem on sadistic behavior. I am also completely new to statistical analysis.

Both of my independent and dependent variables have been measured using standard questionnaires used in the field of research. The independent variables are measured using a 5 point and 4 point Likert scale. The dependent variable is measured using a questionnaire with yes/no items scored with 1/0 respectively. (max score of 20) Each item is assigned a numerical value and the responses are summed to get the scores for each scale.

When I started analyzing the data, I realized that my dependent variable violates most of the linear regression assumptions and is bounded at 0 with a lot of near zero values. Linear regression results proved to be pretty meaningless.

On further analysis of my dependent variable, I realized that the sadism scale is essentially measuring a count of the questions answered positively. (An example question: Has imagining that you or someone else were causing pain to somebody ever excited you sexually?) and to me, this fits well for something like a negative binomial regression model which is used for modeling count variables. Is this a viable approach for me to explore for my problem?

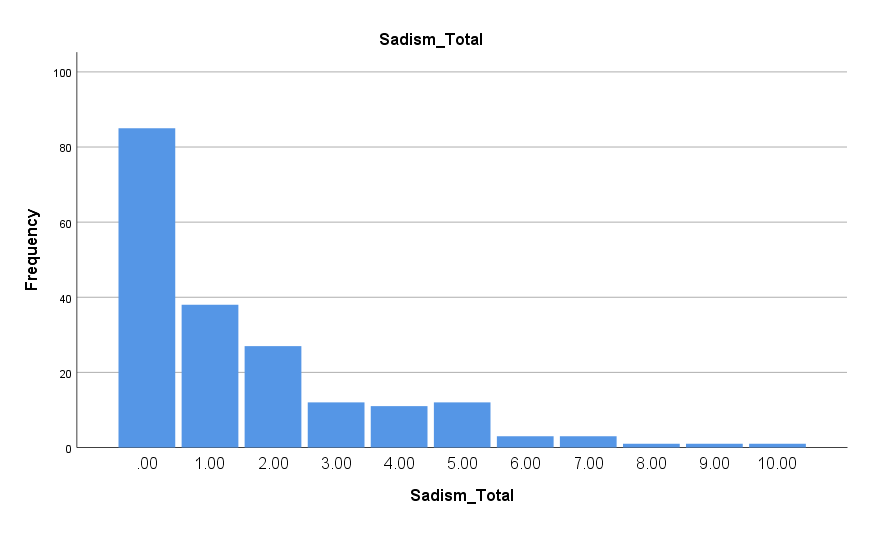
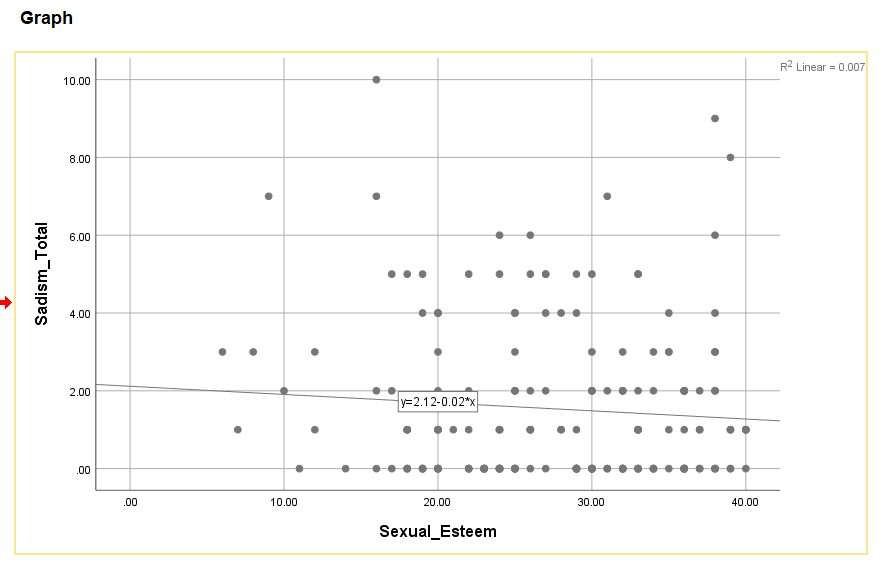
Frequency distribution of the dependent variable Frequency distribution of the dependent variable Scatter plot of IV vs DV Scatter plot of IV vs DV
$\endgroup$

1 Answer 1

2
$\begingroup$

The negative binomial GLM is a standard model for regression problems where the dependent variable is a count value (i.e., a non-negative integer). This would be a good model form to start with. Like any regression analysis, you should check your model using diagnostic methods, and this might lead you to change to a different model form. Nevertheless, a negative binomial GLM is a good starting point.

$\endgroup$
5
  • $\begingroup$ I performed a negative binomial regression test using SPSS, and the p-value for the likelihood ratio chi-square test (omnibus test) was not significant. This was interpreted as the model not being better than the null model. Is there anything I can do to fix this or does this indicate a problem with my data? Would a zero inflated model provide better results? $\endgroup$ Commented Apr 18, 2020 at 10:07
  • 1
    $\begingroup$ Your distribution seems to be quite consistent with a binomial distribution. It is true that the upper limit of 20 does not seem to be biting. It's unlikely that a zero--inflated model will perform much better than what you tried, but that is just a guess from experience elsewhere. What's obscuring discussion, and it is not easy to ask a better question, is that for any model it's the distribution of the response given covariates that is important, not so much the marginal distribution such as you show us. $\endgroup$
    – Nick Cox
    Commented Apr 18, 2020 at 10:19
  • $\begingroup$ Someone completely new to statistical analysis needs more support from your institution, colleagues, fellow students. These are quite tricky models even for experienced people. You've never, ever learned or used means, histograms, scatter plots, simple regression? $\endgroup$
    – Nick Cox
    Commented Apr 18, 2020 at 10:21
  • $\begingroup$ I have followed a statistics module sometime back; but this is the first time i'm getting my feet wet with an actual data analysis like this, and it is definitely taking me places that I've not been before. Could you explain a bit more on what you mean by, "for any model it's the distribution of the response given covariates that is important"? I have also added a scatter plot of my IV vs DV if that might help better understand the situation. $\endgroup$ Commented Apr 18, 2020 at 12:24
  • $\begingroup$ @fsociety: It is not possible to tell if the model is reasonable based on the significance or non-significance of a variable. Assuming the model is a reasonable one, the proper interpretation is that the null model is just as good as the one with the explanatory variable in it (i.e., that explanatory variable is not related to the response). Be careful about trying to "fix" null findings, since this is an attempt to reason to to a pre-emptive conclusion. $\endgroup$
    – Ben
    Commented Apr 20, 2020 at 10:10

Your Answer

By clicking “Post Your Answer”, you agree to our terms of service and acknowledge you have read our privacy policy.