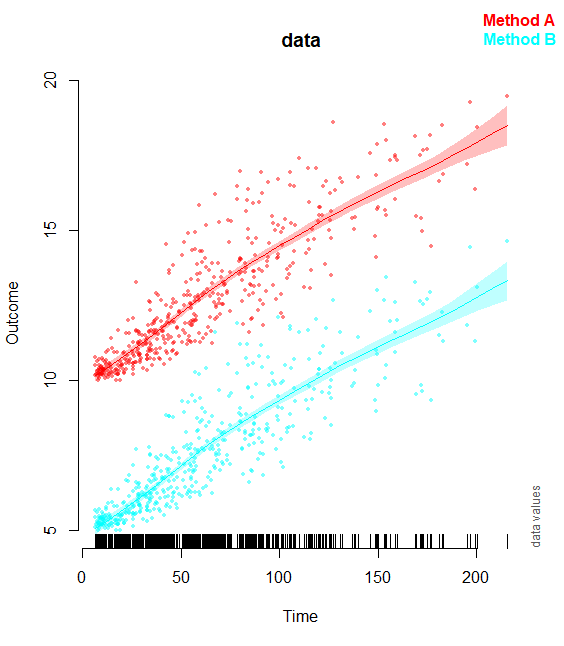
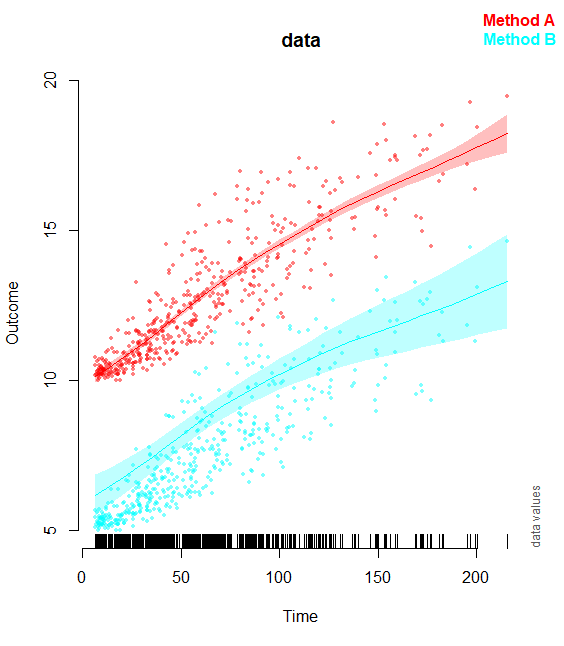
4
$\begingroup$

I am hoping for advice on how best to specific a GAMM (mgcv) that specifies random smooths for each subject at separate levels of a repeated measures factor.

My dataset includes the following variables:

  1. id - subject id factor
  2. Time - continuous covariate with repeated observations within each subject (0, 1, 2, 3 mins, etc.)
  3. Method - factor variable denoting which method was used to produce the Outcome variable. This factor is repeated within a subject. The two levels of this variable is "old" and "new" (coded as 0 and 1).
  4. Outcome - continuous covariate of a physiological variable (e.g., blood pressure) determined by either the "new" or "old" method.

I have tried fitting the following GAMM to the data:

mdl <- gam(Outcome ~ Method + ti(Time) + ti(Time, by=Method) + s(id, Time, bs = 'fs')

However, the fitted response is a little absurd and does not describe the general nonlinear trend in data (e.g., fitted response is . I figure that part of this issue is because I am not correctly specifying that the random smooths should be fit to each level of Method within each subject. I do not know what syntax to use to achieve this goal - does anyone have any suggestions/advice?

Thanks in advance!

[EDITED 28/04/2020]

I have included an example of how my data is structured below:

    Row      id      Method             Time      Outcome
-------------------------------------------------------------
    1       122    Method A                9    10.374115
    2       122    Method A               11    10.321619
    3       122    Method A               26    12.061685
    4       122    Method A               34    12.642345
    5       122    Method A               44    13.665468
    6       122    Method A               51    14.151617
    7       122    Method A               56    14.324933
    8       122    Method A               63    15.175470
    9       122    Method A               74    15.332778
    10      122    Method A               84    15.979175
    11      122    Method A              106    16.479397
    12      122    Method B                9     5.407808
    13      122    Method B               11     5.344450
    14      122    Method B               26     7.155621
    15      122    Method B               34     7.759154
    16      122    Method B               44     8.814453
    17      122    Method B               51     9.313105
    18      122    Method B               56     9.493768
    19      122    Method B               63    10.388376
    20      122    Method B               74    10.538343
    21      122    Method B               84    11.208679
    22      122    Method B              106    11.697866
    23      137    Method A                8    10.000000
    24      137    Method A               15    10.252286
    25      137    Method A               22    10.371262
    26      137    Method A               33    11.217497
    27      137    Method A               33    10.965507
    28      137    Method A               44    12.191451
    29      137    Method A               55    11.824798
    30      137    Method A               66    12.892554
    31      137    Method A               84    15.038724
    32      137    Method A               97    15.230533
    33      137    Method A              115    17.052102
    34      137    Method A              140    16.755750
    35      137    Method A              156    17.318535
    36      137    Method B                8     5.000000
    37      137    Method B               15     5.229901
    38      137    Method B               22     5.338714
    39      137    Method B               33     6.120323
    40      137    Method B               33     5.889458
    41      137    Method B               44     7.036846
    42      137    Method B               55     6.699954
    43      137    Method B               66     7.703832
    44      137    Method B               84     9.761504
    45      137    Method B               97     9.975060
    46      137    Method B              115    11.677906
    47      137    Method B              140    11.437684
    48      137    Method B              156    11.973593

There are a total of 40 subjects, with each subject having Outcome measured by Method A and Method B at identical points in time.

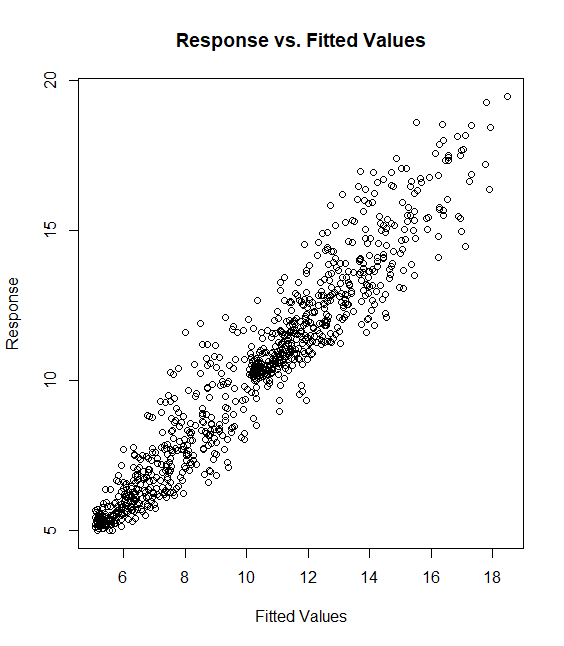
I get a reasonable fit to the data if I do not include ANY random effect terms in my GAM. This model has the form of:

mdl1 <- gam(Outcome ~ Method + s(Time) + s(Time, by=Method), data=foo, method=REML)

The Response-v-Fitted values and the overall trend plots look like this for mdl1:
However, when I try the model suggested by @gavin I get this strange offset where the smooth looks like it follows the data well for Method A, but is for some reason displaced higher up the y-axis for Method B. This model takes the formula of:

mdl2 <- gam(Outcome ~ Method + s(Time) + s(Time, by=Method, m=1) + s(Time, id, bs='fs', by=Method), data=foo, method=REML)

The Fitted v Response and trend plots for this model look like this:
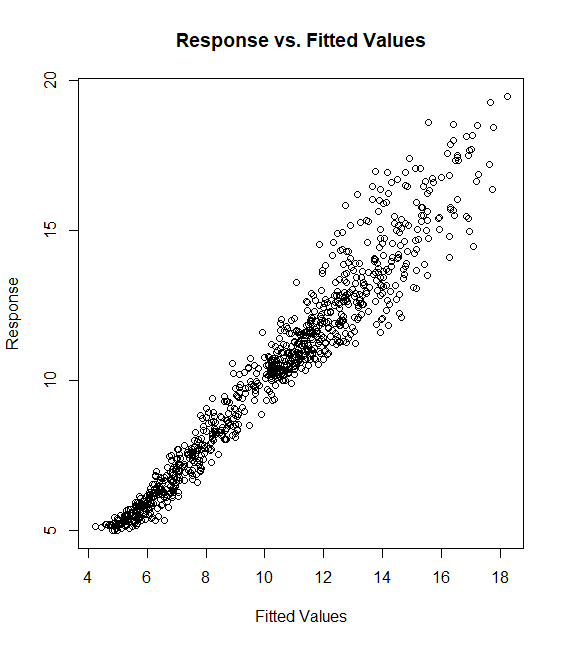
After trying various forms of random effects (s(id,bs='re'),s(Time,id,bs='re'), etc.) I get similar results, where the overall fixed effect trend seems to take on a reasonable shape, but is offset vertically from the observed data by variable amounts.

Perhaps it is something to do with how my data is coded? Something related to the fact that the two levels of Method (A and B) are observed twice within a given subject?

$\endgroup$
0

2 Answers 2

3
$\begingroup$

Nb; don't use ti() for univariate smooths: it currently works but Simon Wood, maintainer of mgcv has remarked that this may be removed in a future version of the package.

I think the main problem is that you have the factor and continuous variable back to front in the fs smooth. time is the continuous covariate so you want a smooth of it for each level of the factor id:

s(time, id, bs = 'fs')

Rewriting your model we have:

mdl <- gam(Outcome ~ Method + s(Time) + s(Time, by = Method, m = 1) +
             s(Time, id, bs = 'fs'), data = foo, method = 'REML')

Note that I have added m = 1 to the by factor smooth as the separate smooths by levels of a factor can ofetn be concurved with the global smooth of the same covariate. You could also make Method and ordered factor and then you wouldn't need m = 1 as mgcv would set the smooths up as:

  1. s(Time) reflecting the smooth effect of Time in the reference level of Method, and
  2. s(Time, by = Method) reflecting smooth differences of the Time effect between the reference level smooth and the remaining levels of Method.

I don't quite follow exactly how your data are structured. It might be sensible (you decide) to allow different random smooths in the two methods? E.g.

mdl <- gam(Outcome ~ Method + s(Time) + s(Time, id, bs = 'fs', by = Method),
           data = foo, method = 'REML')

or

mdl <- gam(Outcome ~ Method + s(Time) + s(Time, by = Method, m = 1) +
             s(Time, id, bs = 'fs', by = Method),
           data = foo, method = 'REML')

depending on whether you want separate global smoothers for the levels of Method.

You don't often need the m on the fs basis smooths as these are fully penalised, but you might get a harmless warning about multiple smooths of the same covariate, which in this instance should be OK to ignore.

$\endgroup$
6
  • $\begingroup$ I have tried both those suggestions and still get strange results. I edited my original question to include some example data and some figures of my attempt to use the GAM with your suggested random effect terms. Is it perhaps something to do with how my id or methods variables are coded? Or maybe the GAM is just not converging well enough? (Though I get no errors from the model output) $\endgroup$
    – TJC
    Commented Apr 28, 2020 at 19:49
  • $\begingroup$ From the Fitted vs Observed plot it seems that the data have a non-constant mean variance relationship which suggests that assuming the response is conditionally distributed Gaussian is incorrect. Look at the plots produced by gam.check() and you should see problems in the residuals plots drawn. I would suggest using family = Gamma(link = 'log') or family = tw() as starting points to fix this problem, using the same model structure $\endgroup$ Commented Apr 28, 2020 at 21:41
  • $\begingroup$ Actually, ignore that (well, don't but I may be ignoring the random effects). Still it might be worth switching to a distribution that is positive if the response can't be negative. $\endgroup$ Commented Apr 28, 2020 at 21:43
  • $\begingroup$ The gamma/tweedie distributions are a good idea to try and account for the nonconstant variance. I did however try recoding the id variable to be unique to each subject AND method, e.g., subject 122 now has two id values that relate to method A and B (122_A and 122_B). Recoding the id label like this, and fitting mdl2, produces the fit with the closest resemblance to the first two figures above. I just worry that the GAMM now thinks there are twice as many subjects now, and I'm not adequately accounting for the clustering of data within a subject... If that makes sense? $\endgroup$
    – TJC
    Commented Apr 29, 2020 at 5:30
  • 1
    $\begingroup$ It turns out that there seems to be an error in the plotting of the GAMM using itsadug in R version 4.0. I rolled back my R to 3.6.3, and also my itsadug version to 2.3 and the plotting works just fine now (no weird offsets). I have accepted @gavin-simpson answer now that everything looks fine. Also - is it normal that the confidence bands for the fixed effect predictions are so narrow relative to the visual scatter in individual points? $\endgroup$
    – TJC
    Commented May 5, 2020 at 14:37
0
$\begingroup$

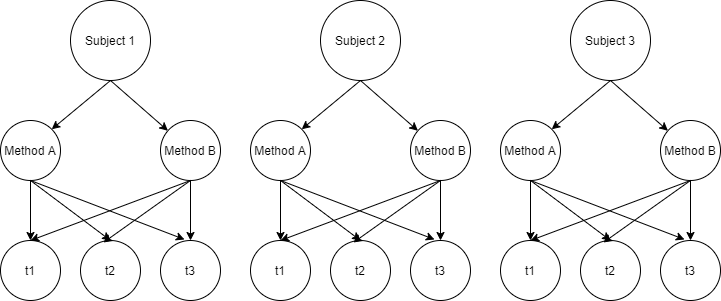
Just in case it would be helpful, I have tried to illustrate how my data would be nested (in addition to the example in my table above).

Here, each timepoint (t1,t2,t3,etc.) gets "observed" by two different methods of calculating Outcome, i.e., Method A and Method B. Each set of Outcome values across time points for each Method are nested within a given subject.

Am I pushing the gam() function too hard with this type of cross random effect design? Should I try switching to gamm() or gamm4() and take advantage of the more familiar way of defining random effects (which in my case I guess it would be something like (1+Time|id/Method))?

EDIT: Sorry I guess that should be (Time|id) + (Time|Method) for crossed effects right?

Data nesting diagram

$\endgroup$

Your Answer

By clicking “Post Your Answer”, you agree to our terms of service and acknowledge you have read our privacy policy.

Not the answer you're looking for? Browse other questions tagged or ask your own question.