The basic reproduction number $R_0$, and effective reproduction $R_t$ are parameters in a simplified model. It represents how many other people are being infected by a person that it infected.
With a detail that $R_0$ is the case for reproduction in a population that is fully susceptible. If people become immune due to vaccinations, due to early encounters with the disease, or maybe they just don't get hit without those, then the effective reproduction will be less than the basic reproduction.
Firstly, I'm confused as to how the $R_0$ value relates to the doubling time. Is there a direct mathematical relationship between the two?
In the beginning, when nobody is immune, then the effective reproduction is equal to the basic reproduction. Say $R_0 = 2$ then the first sick person will infect 2 other people, those 2 will infect 4 other people, those 4 will infect 8 other people, those 8 will infect 16 other people and so on (this is an simplified model, in reality it is not so deterministic and the growth is less homogeneous).
So the infection grows with a factor $R$ each generation, but how fast it grows depends on how fast a generation passes on the virus. This will differ from disease to disease. With respiratory disease (influenza, common cold, SARS/Corona) this goes fast, but with a sexual transmittable disease this is much slower (because people do not have, on average, so many contacts during which the disease transfers).
When people are estimating the value $R_0$ then they use the growth rate, in combination with the time between generations (or a more complex combination of parameters, like incubation time, time of duration of infectious period, time between successive infection moments, etc.). An example computation is in the very similar question here https://stats.stackexchange.com/a/461251/164061
The $R_0$ is relevant, aside from the growth rate (or the doubling time which is just the inverse of growth rate), because it relates to the amount of people that need to be immune before the virus stops spreading/stabilized. The effective reproduction, $R_t$, number is the basic reproduction number multiplied with the fraction of people that are susceptible (not immune).
If this effective reproduction number is below 1 then the spread stabilized/reduces, because each next generation will be smaller than the previous generation. (This is actually not true in general, and only in the simplified model. In reality the reproduction is heterogeneous, and if the average basic reproduction, multiplied with fraction susceptible, is below 1 then there might still be a sub population where contact and spreading is still relatively high and increasing spread of the virus can still occur).
In these cases, if you see an decrease in the number of new cases day over day (but still non-zero new numbers of cases), can the Rt still be >1?
The growth rate is equal to
$$(R_t-1) \frac{1}{t_{generation}}$$
$R_t$ is for the number of people that get infected by a sick person, $-1$ is for the person that get's better after infections $R_t$ people (and so the net change is $R_t-1$), and $t_{generation}$ is for how long it takes between generations.
So in the simplistic view: yes, you get a decrease (negative growth rate) if $(R_t-1)$ is negative.
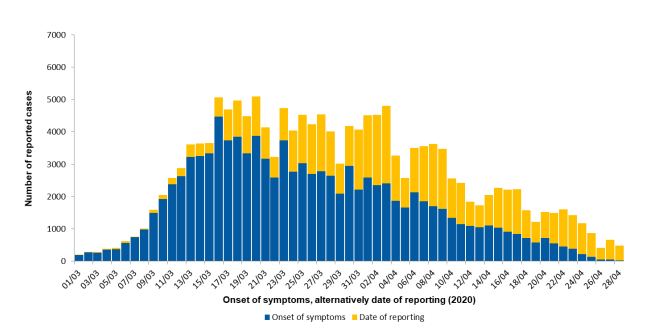
In reality the curves behave less ideal and relate to biased measurements (e.g. the one that you show has peaks every Sunday/Monday due to sampling variations, even when it is corrected from date of reporting to date of onset of symptoms).
So decreases might be due to that bias (changes in sampling and reporting). Also the virus may have spread to other parts in the society where sampling is done less actively (the $R_t$ and $R_0$ values assume homogeneous situation which is not realistic).
Also a decrease might be due to random irregularities. The spread goes in waves (due to inhomogeneous growth as function of time and space, effects of weather, population density and composition where the spread currently resides, and variations in timing of events that increase/decrease spreading).
The curve from the Robert Koch institute shows a strong decrease, so I would consider that the reproduction is below 1. But when it becomes above 1 then it takes a while before the numbers pick up. The getting sick, onset of symptoms, and date of reporting are not the same. So there is a delay. So that is a (theoretical case) that numbers are decreasing while the reproduction is above 1.
Also, theoretically you could have a reproduction above 1 but a change in the time between generations. In such a situation you can get a decreasing number while the reproduction is still above 1. This is however not very practical (it may occur when the virus evolves into something that stays longer).
It is not likely for respiratory diseases, but the case of sexual transmittable diseases could relate to this because people are infectious over a long period. Then say, a virus like AIDS may cause initially many cases because of people having lots of sexual contacts, and reduced contacts (in response to the disease) may decrease the cases, but it can be still that the reproduction is above 1. In this case of STD's you also have that generations overlap. A person that got a next person sick might still be sick and continue making other people sick.
 In these cases, if you see an decrease in the number of new cases day over day (but still non-zero new numbers of cases), can the $R_t$ still be $> 1$?