1
$\begingroup$

I'm doing a time series analysis of some groundwater wells and as such the data set has a strong yearly seasonality. The data is daily and I am using a Fourier term to account for the seasonality in my ARIMA model. To determine the k value for the Fourier term(s) to be used I wanted to pick a model with a minimized AICc. I'm confused about the results of the model and am now uncertain about my understanding of the concept of Fourier terms and of the code I'm using.

The data for PS1302 is available here https://www.dropbox.com/sh/563nu3daeid0agb/AAB6NSddVUKgBCCbQtuqXPsZa?dl=0 and my code is shown below.

#Daily Piezometric Data from PS13-02
PS1302 = read.csv("PS13-02.csv",TRUE,",")
#impute missing data from data set
PS1302 = imputeTS::na_interpolation(PS1302)
#Create Time Series
PS1302 = ts(PS1302[,2],frequency = (365.25),start = c(2013,116))    

#PS1302
plots1 = list()
for (i in seq (10)) {
  fit1 = auto.arima(PS1302, xreg = fourier(PS1302, K = i), seasonal = FALSE)
  plots1[[i]] = autoplot(forecast(fit1, xreg = fourier(PS1302, K = i, h=10))) + 
    xlab(paste("K=",i,"AICC=",round(fit1[["aicc"]],2))) + ylab("")
}

gridExtra::grid.arrange(plots1[[1]],plots1[[2]],plots1[[3]],plots1[[4]],plots1[[5]],
                        plots1[[6]],plots1[[7]],plots1[[8]],plots1[[9]],plots1[[10]],
                        nrow=5)

The results of the plots loop are: enter image description here
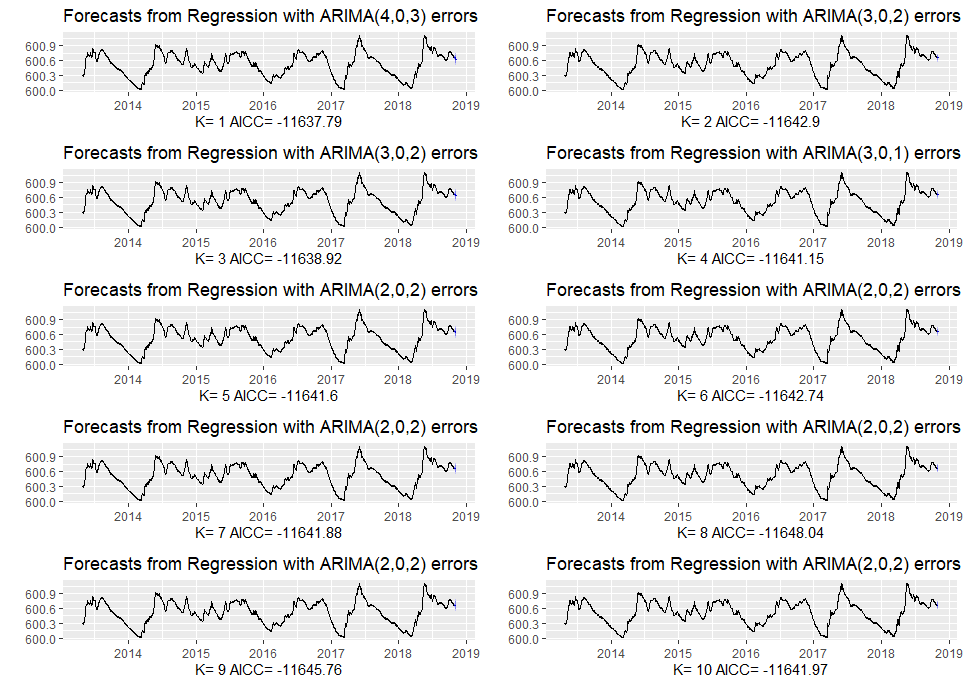
I'm confused about the output of 8 Fourier terms resulting in the lowest AICc. It doesn't make sense to me that there would be 8 different seasonal factors affecting the groundwater wells, I would have expected 1 Fourier term. Additionally when running mstl(PS1302) the decomposition is only of one seasonality of 365.25.

$\endgroup$

2 Answers 2

2
$\begingroup$

There are many ways to look at your results. I'll provide a few things that come to mind here:

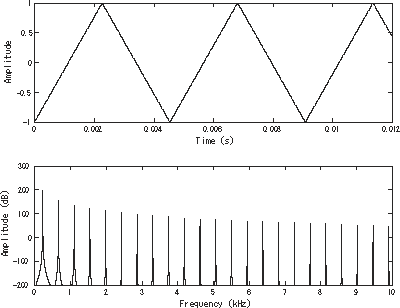
  1. Having 8+ Fourier coefficients doesn't necessarily mean the data is generated from a process having "8 different seasonal factors". In fact it doesn't even imply that there is a complex seasonal pattern. Because of well-known results in Fourier theory about how functions can be approximated arbitrarily-well by Fourier basis functions, having a function be dense in Fourier terms may mean it's actually not seasonal at all. Or it could mean it is seasonal, but doesn't follow a smooth, cyclical pattern that sin/cos waves can efficiently approximate (e.g. a square wave). I would argue your cyclical pattern looks more like a triangle wave than a sine wave. Look how many sin/cos frequencies are needed to estimate a triangle wave:

enter image description here

  1. Let's suppose that you've already taken the previous point into consideration. Are you also cognizant of the fact that—in your data—the the dominant seasonal pattern seems to be an annual one and you only have about 5 years of data? That means we only get to observe this cycle 5 times at most. It's difficult to accurately estimate the parameters for frequency, phase, and amplitude with only 5 noisy realizations therewith. Not only this, but the pattern itself seems not to be present at the turn of 2015—this only makes matters worse when estimating from a limited amount of data.

  2. AICc is a good criteria for balancing model-complexity and fit. But it's not perfect. Often in practice, we use several metrics to get a more holistic or complex idea about how our model may perform out of sample. Furthermore, the difference between your worst (K=1) and best (K=8) is about .08% in AICc. While AICc values don't have such a straightforward interpretation that values can be compared so easily, this difference is still considered rather small and could mean that a slight permutation or corruption of the data could lead to completely different results. (You can overfit to AICc the same way we can with any out of sample method.)

$\endgroup$
1
$\begingroup$

Typically, when you have a single periodic signal this manifests in the Fourier domain as a main spike at its primary frequency, plus additional spikes at its "harmonics". If the signal is a perfect sinusoidal function then it will give only one spike in the Fourier domain (subject to leakage), but if it is not perfectly sinusoidal then it will also have a set of harmonics. The reason for this is that each periodic signal in your data is fit to a linear function of perfect sinusoidal parts. Thus, if a single signal is sufficiently different in shape from a perfect sinusoidal function, it could conceiveably be fit to eight (or even more) Fourier terms.

The periodic signal in your data appears to be a kind of triangular pattern that is quite different to a perfect sinusoidal signal. It has a fairly rapid increase and then a sharp turn to a graduatl decrease. Consequently, when you fit this pattern in the Fourier domain, it is built up as a linear function of perfect sinusoidal parts based on an initial primary frequency and a set of harmonics. If you take the output of your model you should be able to plot the individual Fourier terms and then see what it looks like when you add these up --- they should give a good approximation of your periodic signal.

$\endgroup$

Your Answer

By clicking “Post Your Answer”, you agree to our terms of service and acknowledge you have read our privacy policy.

Not the answer you're looking for? Browse other questions tagged or ask your own question.