1
$\begingroup$

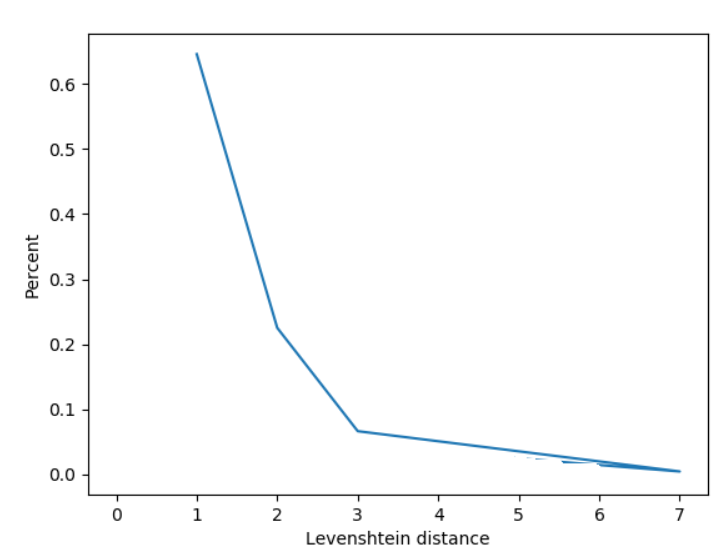
I'm trying to find a statistical way to get an approximate distribution of all human noising. I have a dataset of over 300,000 samples of people noising words. I took basic Statistics and I would know how to do this for finding the mean or confidence interval of a Gaussian, but given the plot of the data it fits closer to an exponential distribution. I'm hoping to find a confidence interval or an approximate distribution of the true distribution of human noising on words given the data below.

enter image description here

The statistic used is the Levenshtein distance, which is the minimum number of insertions, deletions or letter substitutions needed to convert a misspelled (noised) word into a correct spelling (clean word). This was applied to calculate the percent out of the 300,000 words that the distance was x, where y is the percent of the sample and x is the Levenshtein distance. The words in the sample dataset are of varying length.

Given this sample I want to infer the distribution of the Levenshtein distance of single word noising of the population, which I'm assuming will also be an exponential or exponential.

$\endgroup$

1 Answer 1

3
$\begingroup$

Following a reduction of Levenshtein distance between the original question and the current version, one can say that the total frequency of words that needed correction is merely the sum of all the $x$-values, let us call that the $L$ percentage. Assuming that this is actually exponentially distributed in $x$, which is not a good model for this (see below), the cumulative scaled distribution would be $L(1-e^{-\lambda x})$. However, the question is rather how would $L$ be distributed. For that, let us first suppose that we repeat the experiment $n$ fold to produce $n$ distributions, and add them up value for value, then we would be summing outcomes, which would be convolution, and that would produce an Erlang distribution, A.K.A. special case gamma distribution. However, I am not sure I would do that. Rather, this is a discrete distribution and the exponential distribution is continuous, i.e., $x$ cannot be $1/2$, for example. So the geometric distribution may be a better model.

$\endgroup$

Not the answer you're looking for? Browse other questions tagged or ask your own question.