I have not seen papers deprecating the use of bootstrapping
for 2-sample tests. However, among re-sampling methods, I prefer
to use a 2-sample permutation test when unsure of the normality
assumption. When also unsure of homoscedasticity, I would use
the Welch t statistic as the metric of the permutation test. [Do you have references about not using bootstrapped 2-sample t tests? I'm always happy to have my preferences backed up by facts.]
However, your comparison of the behavior of several different tests makes the point that your bootstrapped 2-sample t test does give reasonable results for your data. Questions remain whether for sample sizes 30 and 19, sample means are close enough to normal that a straightforward Welch would give valid results. (Of course, the usual caveat applies that one should not do several different tests for the purpose of picking the test with the smallest P-value.)
I don't have your data at hand, so I can't add a permutation test
to your list of tests for direct comparison. But I can show
results of a permutation test for data that may be somewhat similar to yours for purposes of illustration. (In R, sample without
additional parameters permutes its argument.)
set.seed(2020)
x1 = round(rgamma(30, 5, .1),2)   # mean 50
x2 = round(rgamma(20, 6, .08),2)  # mean 75
x = c(x1,x2);  g = rep(1:2, c(30,20))
t.test(x ~ g)$p.val
[1] 0.0109518
t.obs=t.test(x ~ g)$stat;  t.obs
        t
-2.669206
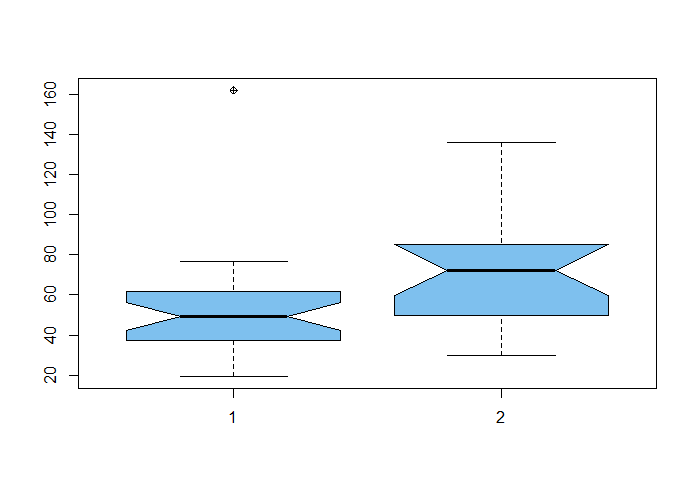
Boxplots of the two samples are shown below. Nonoverlapping notches, based on a nonparametric test, suggest that population
locations differ. The wider box corresponds to the larger sample.
Shapiro-Wilk tests show that x2 is not consistent with sampling from a normal population, but the normal null hypothesis is rejected for x1 with a tiny P-value.
boxplot(x~g, var=TRUE, notch=TRUE, col="skyblue2", pch=10)

We see that the P-value of the Welch t test and the
the P-value of the two-sample test that uses the Welch t
statistic as metric are essentially the same. This suggests
that the two sample means are sufficiently close to normally
distributed not to ruin the P-value of the Welch test.
set.seed(526)
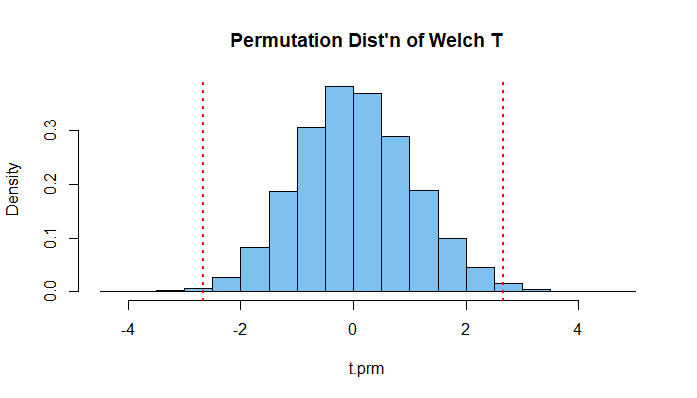
t.prm = replicate(10^5, t.test(x~sample(g))$stat)
mean(abs(t.prm) > abs(t.obs))
[1] 0.00963  # P-value of permutation test
The permutation test has the advantage that the exact
permutation distribution could, in principle, be derived
using combinatorial methods. (For example, the most
negative value of the permuted t statistic occurs when the largest 30 of the 50
observations are randomized to the first group.) The simulation procedure generates enough random values from the true permutation distribution of Welch's $T$ to give a useful P-value.
hist(t.prm, prob=TRUE, col="skyblue2",
     main="Permutation Dist'n of Welch T")
  abline(v=c(t.obs, -t.obs),
         col="red", lty="dotted", lwd=2)

Note: The R code for the permutation test 'steals' the
Welch t statistic (witn $-notation) for each permutation of 50 samples into respective groups of 30 and 20. Because t.test computes quantities not directly uses for the permutation test, the program runs more slowly than would if optimally programmed.
Other than laziness, the method with $ ensures that I am
using exactly the version of the Welch test implemented in R.)


