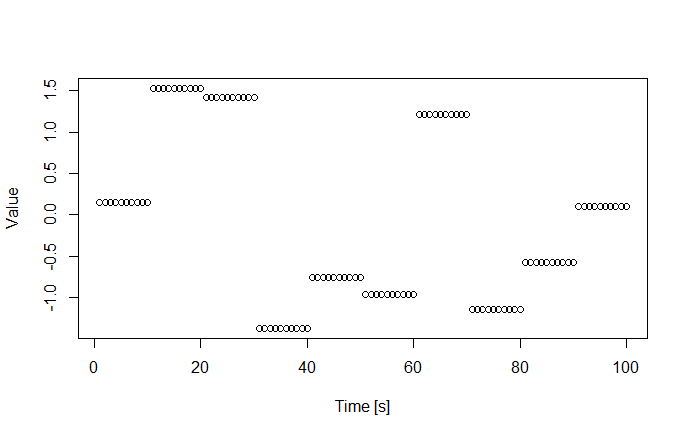
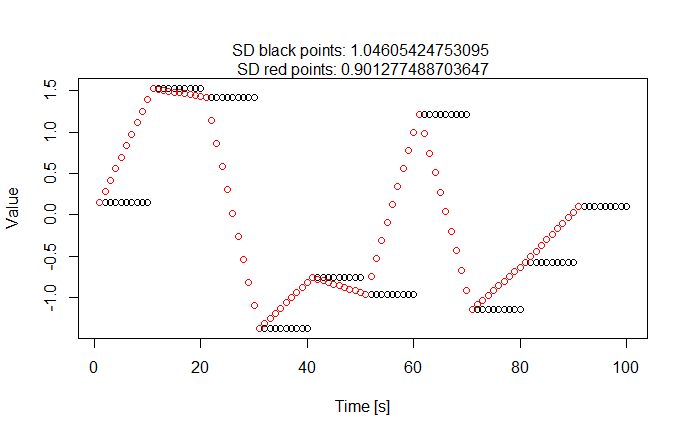
So I have amplitudes following a normal distribution with $\mu = 0$ and $\sigma = 1$. Now a certain amplitude "live" for a fixed time and then a new one is drawn from the distribution. Due to physical reasons I now want to interpolate between these amplitudes, which lowers the standard deviation. How can I calculate this correction factor? Empirically it is ~1.22, but how can one calculate it?
Example:
Shall become:
amplitudes_digital <- rnorm(10)
amplitudes_digital_stretched <- sapply(amplitudes_digital, rep, times=10)
# test3 <- matrix(nrow=ncol(test2)*nrow(test2), ncol=1)
amplitudes_digital_stretched2 <- stack(as.data.frame(amplitudes_digital_stretched), select=1:10)
plot(c(1:nrow(amplitudes_digital_stretched2)),
       amplitudes_digital_stretched2[,1], xlab="Time [s]", ylab="Value")

amplitudes_interpolated <- approx(x=c(0:9)*10+1,
                                  y=amplitudes_digital, method="linear",
                                  n=nrow(amplitudes_digital_stretched2)-length(amplitudes_digital)+1)
points(amplitudes_interpolated$y, col="red")
mtext(paste("SD black points:", sd(amplitudes_digital_stretched2[,1]), "\nSD red points:",
        sd(amplitudes_interpolated$y) ) )


