If test scores are nearly normal, then consider using the ANOVA model explained
in the Wikipedia article linked in @Dave's Comment.
If there is sufficient departure from normality that you want to use
nonparametric tests, then you can do it in two steps:
(1) For each class $i=1,2,$ find differences $D_{ij}$ of Final minus Midterm for each student $j.$ Then, for each class, use a Wilcoxon signed rank test to see whether the mean difference $\bar D_i$ is significantly different from $0.$
(2) Use a 2-sample Wilcoxon rank sum test to compare $\bar D_1$ and $\bar D_2.$
Suppose the vector d1 of (Final - Minterm) differences $D_{1j}$ for students $j = 1, 2 \dots, n_1 = 30$ in Class 1. Similarly, suppose d2 has differences for the $n_2 = 40$ students in Class 2.
set.seed(2020)
d1 = round(rbeta(30, 5, 2)*15,3)
summary(d1)
   Min. 1st Qu.  Median    Mean 3rd Qu.    Max.
  3.679   8.508  10.361  10.017  11.490  14.908
stripchart(d1, pch="|")
  abline(v=median(d1), col="red")

d2 = round(rbeta(40, 7, 2)*15,3)
summary(d2)
   Min. 1st Qu.  Median    Mean 3rd Qu.    Max.
  8.577  10.583  11.669  11.716  12.938  14.423
stripchart(d2, pch="|")
  abline(v=median(d2), col="red")

It seems that students in Class 1 had score improvements
with a median of about 10.4 points from midterm to final, and that
students in Class 2 the median improvement was slightly greater 11.7
points.
Improvements in both classes were significantly greater than $0.$
Both P-values are near 0, so improvements are highly significant.
wilcox.test(d1)

        Wilcoxon signed rank test

data:  d1
V = 465, p-value = 1.863e-09
alternative hypothesis: true location is not equal to 0

wilcox.test(d2)

        Wilcoxon signed rank test

data:  d2
V = 820, p-value = 1.819e-12
alternative hypothesis: true location is not equal to 0
Now the question is whether amounts of improvement in the two
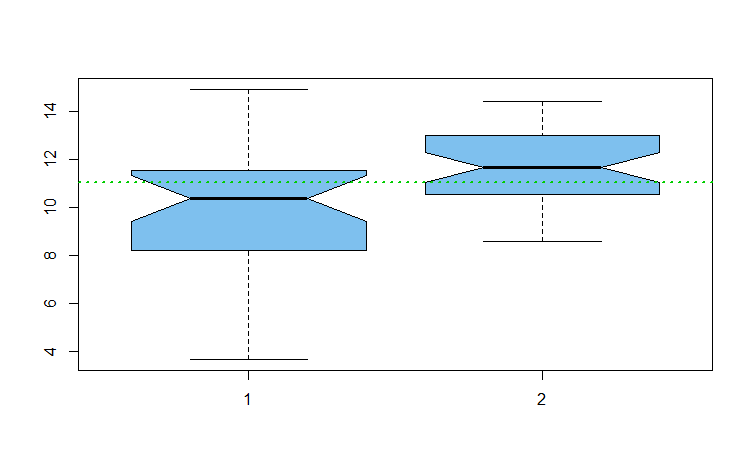
classes were significantly different. Based on an approximate and informal nonparametric test, notches in the boxes of the
boxplots typically do not overlap if there is a significant
difference in locations. The dotted green line shows that
notches may overlap, but only very slightly.
boxplot(d1, d2, notch=T, col="skyblue2")
  abline(h = 11.05, col="green3", lwd=2, lty="dotted")

A printout from R of a formal 2-sample nonparametric Wilcoxon rank sum test follows, showing significance at the 0.3% level.
Students in Class 2 seem to have learned a little more between
midterm and final than did students in Class 1. Finally, it is worthwhile considering
whether difference of 1.3 points in median class improvements is of
any practical importance.
wilcox.test(d1,d2)

        Wilcoxon rank sum test

data:  d1 and d2
W = 352, p-value = 0.002913
alternative hypothesis:
   true location shift is not equal to 0


