1
$\begingroup$

I am new to statistics and am trying on random data sets, one analysis what I am doing is trying to find if there is a relationship between two variables, duration and success where duration is numeric continuous variable and the other, success is categorical.

The distribution of duration variable is not normal, so I believe I am doing non parametric testing, what do you think?

  • Size of the dataset: 45957 for both variables

Given the distribution of "duration" column, I have this fig: Duration distrubition
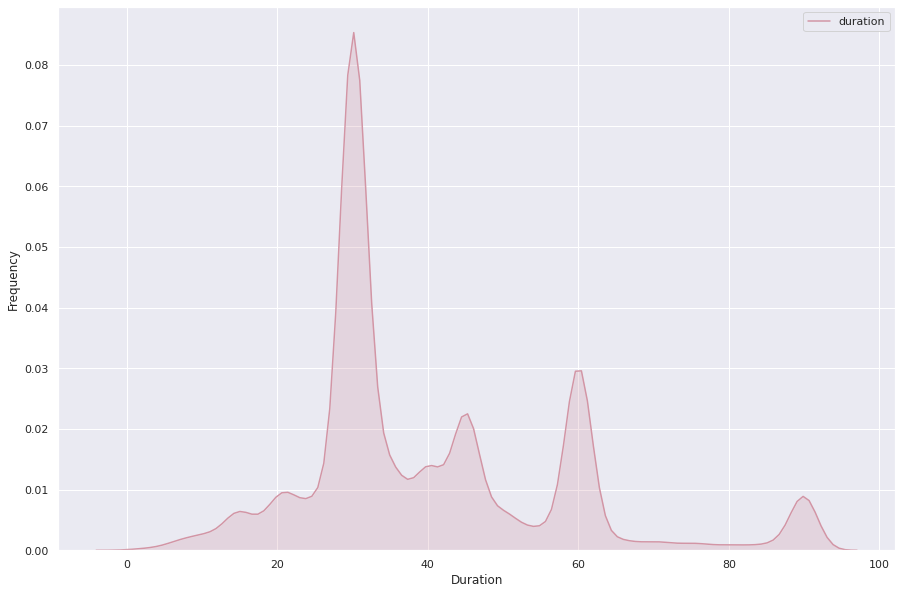
Now I want to analyze what is the best duration/length of time to have a successful campaign, I visualize duration with all types of status:

duration w/ status

With the above relationship, there is no apparent conclusion, so I assume that success, is successful and rest all other categories are fail, I have this viz duration w/ match

Now, I want to be sure, I want to perform a test to come to a certain conclusion.

I have never performed a statistical test in real life so I don't know what to do and how to proceed in practice.

$\endgroup$
9
  • $\begingroup$ You seem to misunderstand the meanings of parametric/nonparametric. in particular, "parametric" doesn't imply an assumption of normality so non-normal doesn't of itself imply that you need to use nonparametric methods. Is your categorical variable ordered or nominal? What sort of relationships are of interest? In what sense are the datasets "random"? $\endgroup$
    – Glen_b
    Commented Jun 25, 2020 at 2:44
  • $\begingroup$ If 'duration' has about the same distributional shape for Success and Failure, then a Wilcoxon rank sum test will help you see whether the Failure distribution is shifted in location relative to the Success distribution. $\endgroup$
    – BruceET
    Commented Jun 25, 2020 at 2:44
  • 1
    $\begingroup$ What about the distribution of the duration variable when it is restricted to each category? And do you see one as the response variable, such as control and treatment groups with “duration” measured? $\endgroup$
    – Dave
    Commented Jun 25, 2020 at 2:47
  • 1
    $\begingroup$ The t-test, particularly for large sample sizes, is quite robust to deviations from normality. Perhaps most important, through: what do you see as indicating a relationship between the variables? $\endgroup$
    – Dave
    Commented Jun 25, 2020 at 2:51
  • 1
    $\begingroup$ What is a relationship, just that the distribution of durations for failures is different from the distribution of durations for successes? How does the EDA show that there’s no relationship? What would be a statistical proof to you? $\endgroup$
    – Dave
    Commented Jun 25, 2020 at 2:55

1 Answer 1

1
$\begingroup$

Suppose the Failure group has observed duration values x1 and the Success group has values x2, as randomly sampled in R below:

set.seed(624)
x1 = rgamma(100, 4, .09)
x2 = rgamma(100, 4, .12)
x = c(x1, x2);  g=rep(1:2, each=100)
boxplot(x ~ g, col="skyblue2", pch=19, horizontal=T)

enter image description here

Then a two-sample Wilcoxon rank sum tests rejects the null hypothesis that there is no difference in the locations of duration scores for the two groups, with P-value 0.0023.

wilcox.test(x~g)

        Wilcoxon rank sum test 
        with continuity correction

data:  x by g
W = 6247, p-value = 0.002322
alternative hypothesis: 
   true location shift is not equal to 0

Note: You don't say what your sample sizes are. With $n_1, n_2$ as large as 100, group sample means might be nearly normal. In that case, a Welch two-sample t test would be appropriate, But I wouldn't want to do a t test for such skewed data if sample sizes are moderate, say 20 to 40.

The P-value for the Welch test is also about 0.002, but there is no reason to expect two-sample Wilcoxon and t tests will generally have P-values that agree so closely. So you should decide in advance which test to use. (Not 'fair' to try several tests and then pick the one with the smallest P-value.)

t.test(x~g)$p.val
[1] 0.002118171
$\endgroup$
4
  • $\begingroup$ Size of the dataset: 45957 for both variables $\endgroup$
    – adam
    Commented Jun 25, 2020 at 3:09
  • $\begingroup$ With sample sizes in the thousands, I think you could use a Welch 2-sample t test. However, 'duration' data might be prone to heavy skewness and far outliers. If your data are like that, then you should consider whether you want to compare 'locations' (as with Wilcoxon) or 'means' (as with t tests). $\endgroup$
    – BruceET
    Commented Jun 25, 2020 at 3:18
  • $\begingroup$ How would someone decide on that? $\endgroup$
    – adam
    Commented Jun 25, 2020 at 3:20
  • $\begingroup$ For a start, I'd be curious what is causing the multiple modes in your duration data. When you look at duration only for individual categories, do some of the 'humps' disappear? // Now you're mentioning additional categories, Live status, Suspended, etc. If these are all mutually exclusive categories, you might want to look at a Kruskal-Wallis nonparametric test first to see if there are any location differences among several categories; if so, use Wilcoxon tests ad hoc to see where the differences are. $\endgroup$
    – BruceET
    Commented Jun 25, 2020 at 3:28

Your Answer

By clicking “Post Your Answer”, you agree to our terms of service and acknowledge you have read our privacy policy.

Not the answer you're looking for? Browse other questions tagged or ask your own question.