0
$\begingroup$

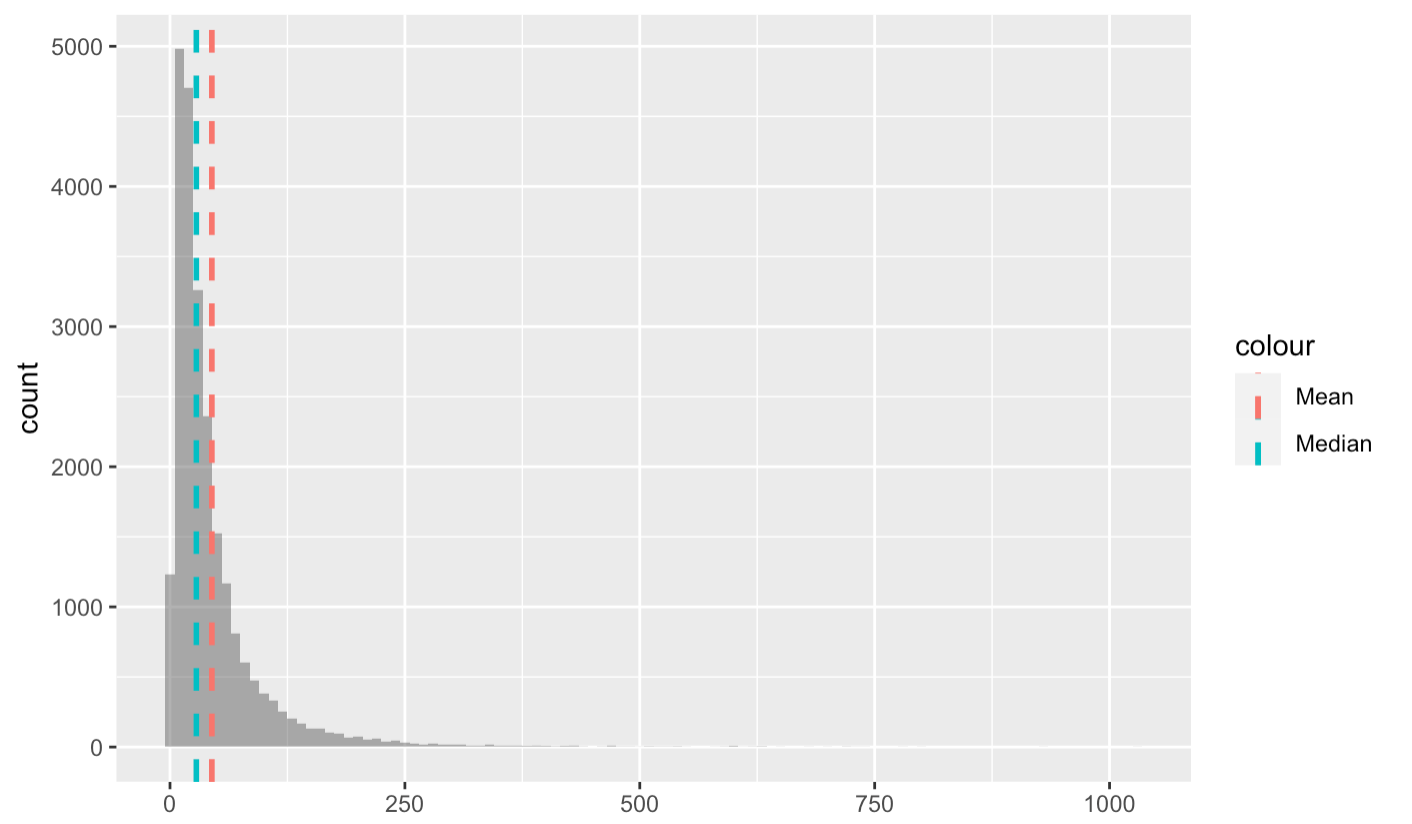
I used Poisson regression model to model how count of user actions on a website (dependent variable) are explained by website content (independent variables). The dependent variable distribution is shown in this plot.

enter image description here

As you can see, the distribution is positively skewed and has a long tail. The results of the Poisson regression model from glm in R are shown here:

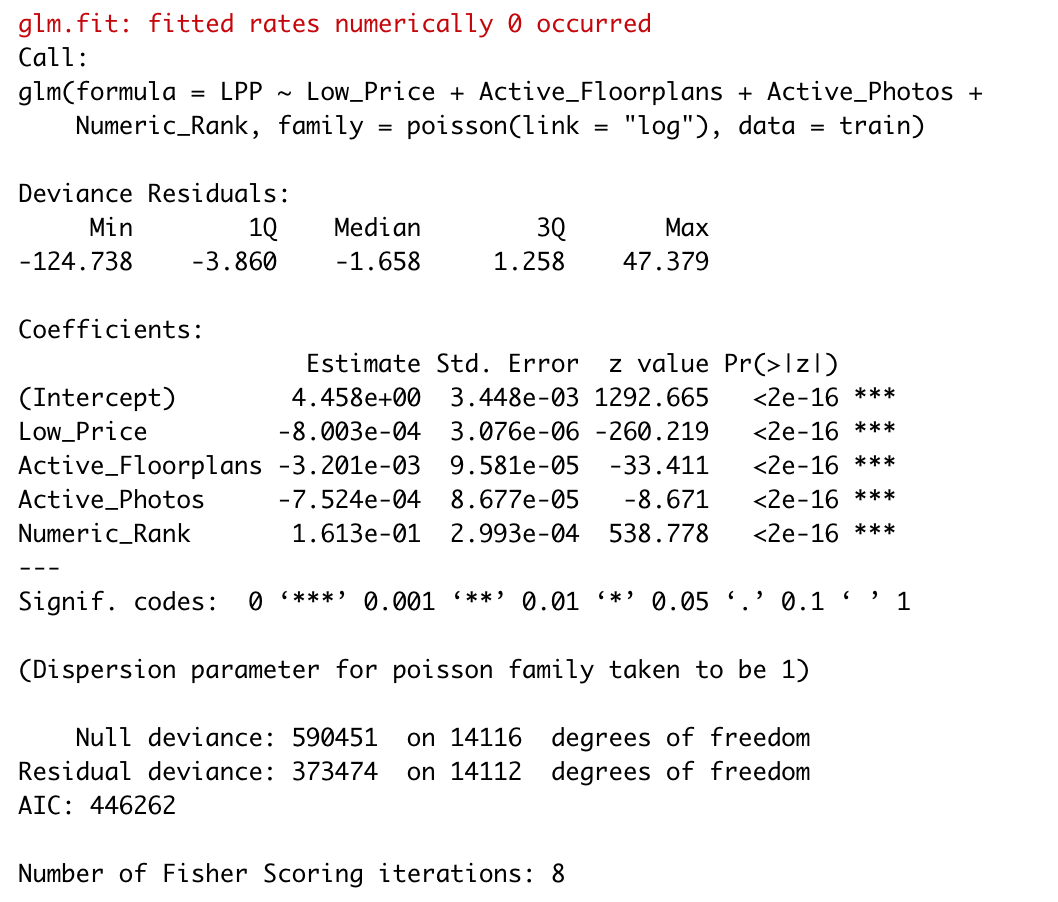
enter image description here

As you can see, residual deviance is much greater than the degrees of freedom, so there is overdispersion. Next, I tried Quasipoissson model that gave these results:

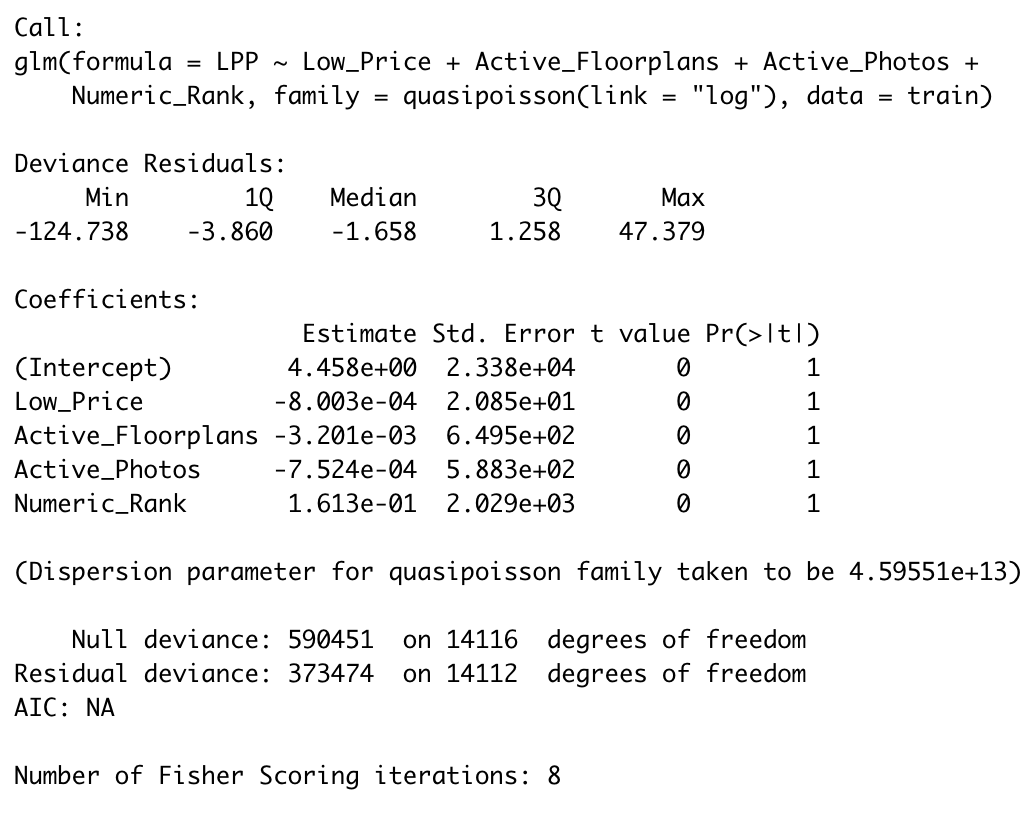
enter image description here

I see that the Quasipoisson model shows that none of the independent variables are significant. I am a little unsure how to interpret these results. Am I handling the overdispersion incorrectly, or am I using independent variables that just do not explain the variation in my dependent variable?

$\endgroup$
5
  • $\begingroup$ Welcome. It could be a convergence issue. But first, I wonder if there is a lot of zeros for subgroups of your covariates. Check the variation in your response for particular covariates such as Active_Floorplans. Try that and see if it fixes the problem. Please follow-up if this doesn’t address your concern. $\endgroup$ Commented Jul 11, 2020 at 22:22
  • $\begingroup$ @ThomasBilach After closer inspection of the independent variables, I am noticing both a lot of zeros and some rather large outliers. For example, Active_Floorplans has ~9% zeros and Low_Price has about 4% zeros. This is quite surprising to me due to the nature of this content. However, Active_Photos has about 1% zeros. When I use LPP ~ Active_Photos as the formula in the Poissson and Quasipoisson model, both do show significance for this variable. I would love to understand this at a deeper level if you can explain or point me to some appropriate reading material. $\endgroup$
    – Charles
    Commented Jul 11, 2020 at 23:20
  • 1
    $\begingroup$ @ThomasBilach Actually, upon closer inspection it appears that Low_Price was the real problem. The Poisson and Quasipoisson models show significance for all variables as long as I drop Low_Price from the model. This variable is discrete/count variable with 4% zeros and a lot of subgroups. Here is a description of that distribution: range = 0-10000, Q1 = 750, Median = 975, Q3 = 1055. $\endgroup$
    – Charles
    Commented Jul 11, 2020 at 23:36
  • 1
    $\begingroup$ So for certain combinations of covariates, it appears there isn’t enough variation in your response. You might wish to enter a factorized version of a regressor on the right-hand side that has multiple subgroups, only to learn that there is a predominance of zeros within that subgroup. This is the likely diagnosis. After dropping some of the variables, can you estimate both models? $\endgroup$ Commented Jul 12, 2020 at 1:07
  • 1
    $\begingroup$ @ThomasBilach Yes, I believe you have solved my problem, and I believe I follow your suggestions about regressor factorization. If you want to write your above comments as an answer, I will mark it as solved. I really appreciate your guidance! $\endgroup$
    – Charles
    Commented Jul 12, 2020 at 1:40

1 Answer 1

0
$\begingroup$

Two issues are likely at play here. One is a convergence failure. The other is adjusting for a covariate(s) with low-cardinality. The likely diagnosis is the latter.

For instance, Low_Price and Numeric_Rank have small estimates of uncertainty and consequently large z-values. This should make you suspicious of your model inputs (covariates). For certain combinations of covariates, there appears to be little to no variation in your response variable. I would assess summaries of LPP by covariate. You might observe a lot of 0's for one particular input. To get around this, you might have to consider dropping a particular covariate or aggregating your data to obtain cleaner estimates.

In the comments, I noted that this often occurs when you blindly throw predictors on the right-hand side of your equation. By "factorized" version of a variable, I meant a variable with many categories (levels). See the basic specification below:

poisson <- glm(LPP ~ as.factor(Floor_Plan) + ..., family = "poisson", data = ...)

where Floor_Plan might be a multivalued factor variable with many levels. R will attempt estimation of all levels of this variable. For any particular subgroup, there might be predominance of 0 counts. This is just something to consider as you make your model more complex. I hope this helps with your intuition.

As a final thought, there are other ways to estimate overdispersion. In the AER package you will find the function dispersiontest, which implements a test for overdispersion by Cameron & Trivedi (1990). Here is the documentation.

$\endgroup$

Your Answer

By clicking “Post Your Answer”, you agree to our terms of service and acknowledge you have read our privacy policy.

Not the answer you're looking for? Browse other questions tagged or ask your own question.