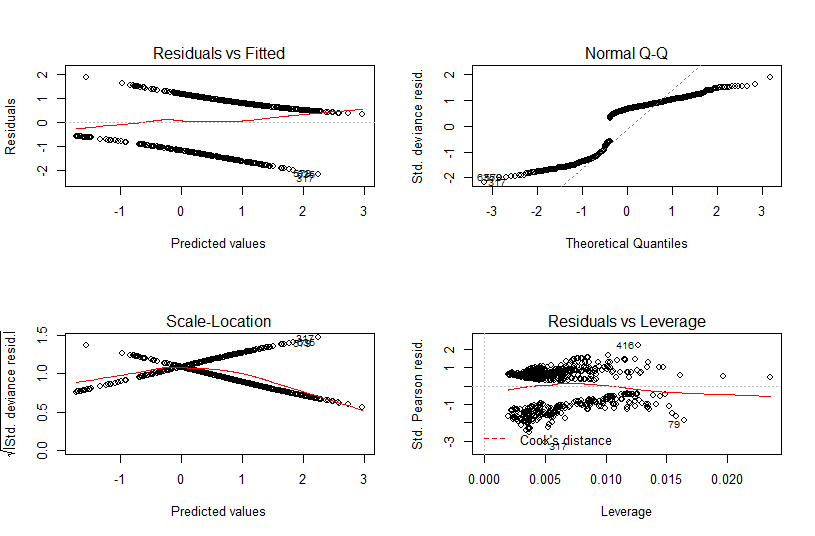
I'm trying to understand the results from a glm I ran. I am doing this for multiple different fish species (one at a time), to see how month, average salinity, temperature, discharge, and rainfall impact their abundance. Below is an example from one fish, I have gotten similar results from other species as well.
I used this data https://drive.google.com/file/d/1Swp0rEFeaInGD4kA1h3xZReFNtho6JPz/view?usp=sharing
and this code to run a GLM on one species
glm.full.bin = glm(binom~Month +Salinity +Temperature +Discharge.x +Rainfall.x,
                   data=fish_B_all,family=binomial)
glm.base.bin = glm(binom~Month,data=fish_B_all,family=binomial)

#step to simplify model and get appropriate order
glm.step.bin = step(glm.base.bin,scope=list(upper=glm.full.bin,lower=~Month),direction='forward',
                    trace=1,k=log(nrow(fish_B_all)))

#final model - may choose to reduce based on deviance and cutoff in above step
glm.final.bin  = glm.step.bin
print(summary(glm.final.bin))

#calculate the LSMeans for the proportion of positive trips
lsm.b.glm = emmeans(glm.final.bin,"Month",data=fish_B_all)
LSMeansProp = summary(lsm.b.glm)

#plot model
par(mfrow=c(2,2))
plot(glm.final.bin)
and the plot shows this.. What does this mean when the residuals and qqplot look like this? Do I need to do something to transform my data to correct this?

