This situation may be a little simpler than yours, but I hope it points the
way to some useful possibilities. Suppose two drugs A and B are under study
for treatment of a condition. One hundred subjects exhibiting the condition are
recruited and randomly assigned, 25 each, to four different 'treatments': A only, B only, both A & B, and neither: for short A, B, AB, and N.
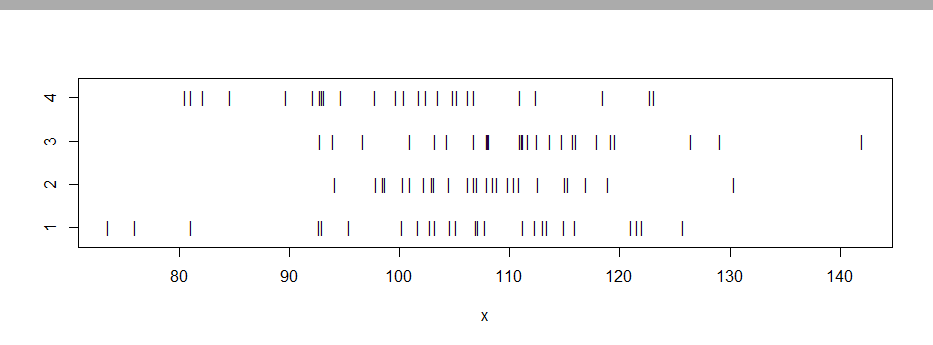
Simulated data might be as follows:
set.seed(2020)
x1 = rnorm(25, 104, 10)
x2 = rnorm(25, 106, 10)
x3 = rnorm(25, 110, 10)
x4 = rnorm(25, 100, 10)
x = c(x1,x2,x3,x4);  gp = rep(1:4, each=25)
stripchart(x~gp, ylim=c(.7, 4.3), pch="|")

You could analyze this as a one-way ANOVA with treatment levels as the factor.
You would have the choice of a standard one-way ANOVA, assuming variances equal
in each of the four groups, or by using the procedure oneway.test in R. For my fake data, there are significant differences among the four group population means, as shown by
the P-value 0.0067.
Then you could use Welch two-sample t tests ad hoc to explore
differences of particular interest: for example, A vs. B, various treatments
using drugs vs. the placebo, and so on. If you are going to look at all six pairs
of the four levels, you should use some method (perhaps Bonferroni) to protect
against 'false discovery'.
oneway.test(x~gp)

        One-way analysis of means (not assuming equal variances)

data:  x and gp
F = 4.5322, num df = 3.000, denom df = 52.201, p-value = 0.006741
However, if it seems clear in advance that the four groups should have equal variances,
you could use a standard ANOVA that assumes equal variances.
lm.out = lm(x ~ as.factor(gp))
anova(lm.out)
Analysis of Variance Table

Response: x
              Df  Sum Sq Mean Sq F value  Pr(>F)
as.factor(gp)  3  1824.4  608.14  4.7253 0.00405 **
Residuals     96 12355.2  128.70
---
Signif. codes:  0 ‘***’ 0.001 ‘**’ 0.01 ‘*’ 0.05 ‘.’ 0.1 ‘ ’ 1
Notice that you have three DF for Factor. As suggested in a comment by @StatStudentm you could look into contrasts. You could use "three pre-planned"
orthogonal contrasts, perhaps ones with coefficients $(1,-1,0,0)$ [to see if drug A is better than B],
$(0,0,1,-1)$ [to see if two drugs are better than none], and
$(1,1,-1,-1)$ [to see if one drug is better than two or none].
Alternatively, you could look at a two-way ANOVA, with factors Drug A (levels Yes and No) and Drug B (levels Yes and No). Then the first three lines of the ANOVA table
would be for Drug A, Drug B, and Interaction. These three would have one DF each, with an F-test for each. [In the one-way ANOVA, you could find three orthogonal contrasts
that correspond to these three lines of the two-way table: $c(1,-1,1-1),$
$(-1,1,1,-1),$ $(-1,-1,1,1),$ respectively.]
A comparison of the standard one-way ANOVA (with contrasts for A, B, and Interaction)
and the standard two-way ANOVA (in which these comparisons are lines in the table). shows that you can 'flatten' a two-way ANOVA to a one-way ANOVA without losing options for comparisons. In many cases, it is simpler to do the two-way ANOVA, especially
if the comparisons of interest correspond to the effects.
If there is concern about unequal group variances, then it seems better to use oneway.test to adjust for unequal variances, and then do ad hoc Welch t tests.
(As far as I know, the Satterthwaite correction used by one-way.test and Welch t tests has not yet been implemented for two and more factors.)


lsmeansorcontrastswhich could clue you in on how you might approach this: stats.stackexchange.com/tags/lsmeans/hot $\endgroup$