I am trying to run a GLM with a Poisson distribution. All my variables Y and X belong to the numeric class. When I run the GLM I always see this warning:
There were 50 or more warnings (use warnings() to see the first 50)
with this content:
1: In dpois(y, mu, log = TRUE) : non-integer x = 45.084920

2: In dpois(y, mu, log = TRUE) : non-integer x = 5.113924

3: In dpois(y, mu, log = TRUE) : non-integer x = 52.057026

4: In dpois(y, mu, log = TRUE) : non-integer x = 1.196172

5: In dpois(y, mu, log = TRUE) : non-integer x = 22.456140

6: In dpois(y, mu, log = TRUE) : non-integer x = 0.741133

7: In dpois(y, mu, log = TRUE) : non-integer x = 54.296875

8: In dpois(y, mu, log = TRUE) : non-integer x = 8.907789

9: In dpois(y, mu, log = TRUE) : non-integer x = 13.480779

...
If I turn my variables from numeric to integer the alarm no longer appears, but I noticed that in this way all the data is rounded to integer values. In this case, my data would lose a lot of information and so I would run a GLM with the original data in numeric class. However, if I try to run a GLM with numerical data and a GLM with integer data, I have two different outputs. I also tried to change the data by multiplying everything by 10^4, in this way I have all integer data without losing information: the result was a third different output.
This is data from a behavioral experiment on some kind of bird. My dataset consists of morphological variables (weight, tarsal length, wing length, staining, etc) and behavioural variables (number of attacks/minute, number of pecks/minute, percentage of seconds in which the individual remains in a given area, etc.). In particular, the morphological variables are X and the behavioral variables are Y. In this case, I want to see if the most aggressive individuals are also those with the best ornaments: for example, I want to see if the number of attacks/minute (Y) depends on staining (X)
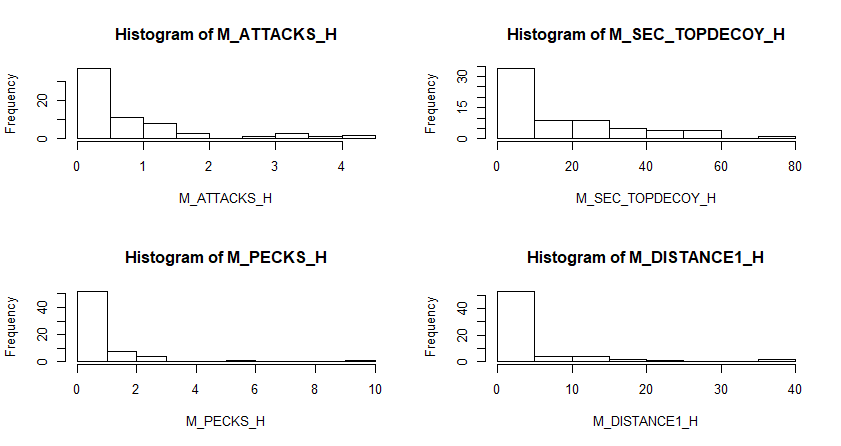
Being biological data, it is important that they are used in original format, not rounded. I tried running a Shapiro Wilk test to see if my data has a normal distribution and also to transform it with logarithm, but in both cases the distribution was not normal. So when I ran a histogram, I realized that their distribution was very close to that of Poisson. How can I solve this problem?
Thank you in advance
