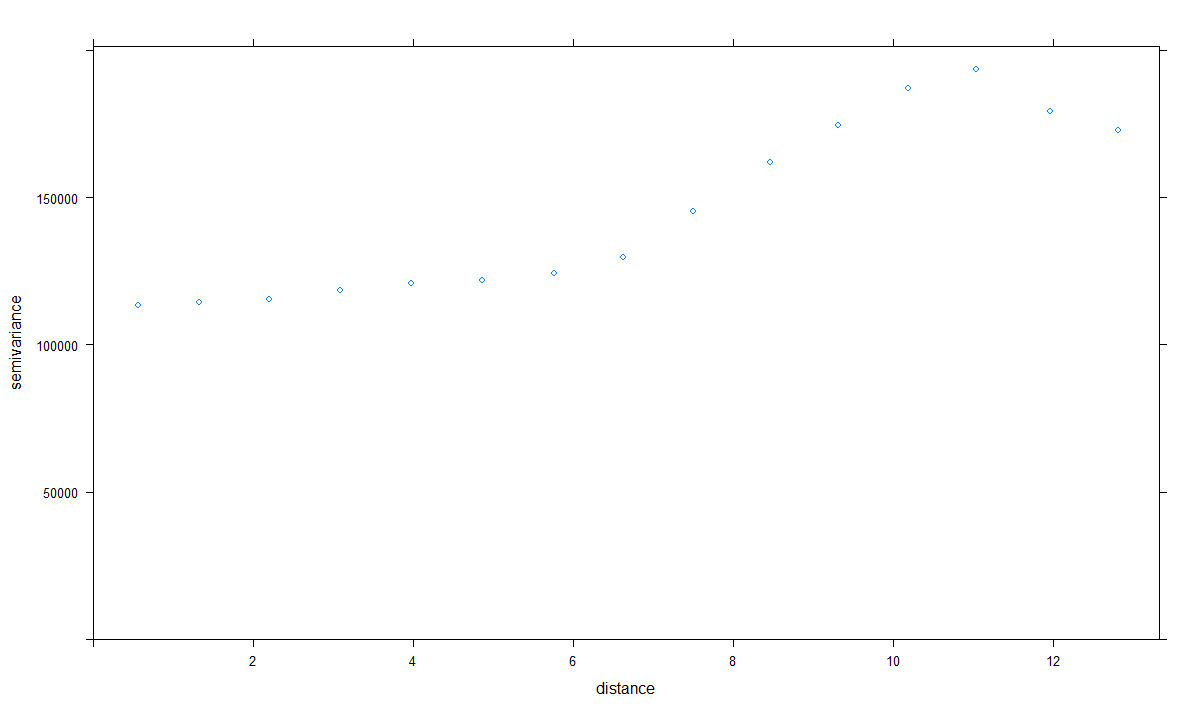
I have taken a shapefile from Open NYC Data and performed the following method. My end goal is to predict Taxi trip_duration at various points across the city of NYC in March at given time segments. I have a source file of Taxi trips that have lon/lat for the pickup and dropoff of each trip. I also have the trip_duration for each trip.
First, I take the shapefile from NYC website here.
Below are my code procedures to create this model.
library(tidyverse)
library(gstat)
library(sp) # install.packages("sp")
library(sf) # install.packages("sf")
library(stars) # install.packages("stars")

# load the shapefile from the NYC data file
shape_sf <- read_sf(dsn = "geo_export_bb23e483-f78f-469f-87f2-00a576a7456f.shp")
> shape_sf <- read_sf(dsn = "geo_export_bb23e483-f78f-469f-87f2-00a576a7456f.shp")

# Not sure if these warnings are important or not.
Warning messages:
1: In doTryCatch(return(expr), name, parentenv, handler) :
  restarting interrupted promise evaluation
2: In get(object, envir = currentEnv, inherits = TRUE) :
  restarting interrupted promise evaluation
3: In doTryCatch(return(expr), name, parentenv, handler) :
  restarting interrupted promise evaluation
4: In doTryCatch(return(expr), name, parentenv, handler) :
  restarting interrupted promise evaluation
5: In doTryCatch(return(expr), name, parentenv, handler) :
  restarting interrupted promise evaluation


# take my raw data frame (with the individual trip data) and turn it into a shapefile type as well
# not sure if I need to change the CRS but I chose it to be matching the .shp file I loaded from NYC
nyc_data_sf <- st_as_sf(nyc_train2, coords = c("pickup_longitude", "pickup_latitude"), crs = st_crs(shape_sf))


# join the nyc_trip data to the shapefile where it contains the points in the shapefile.
shape_df <- st_join(shape_sf, nyc_data_sf, join = st_contains)
although coordinates are longitude/latitude, st_contains assumes that they are planar

# removing missing values of points that were not on shapefile polygons
shape_df_cleaned <- shape_df[!is.na(shape_df$trip_duration),]

# create grid of values to predict for
spat_pred_grid <- expand.grid(lon = seq(min(nyc_train2$pickup_longitude)-1, max(nyc_train2$pickup_longitude) + 1, length = 20),
                              lat = seq(min(nyc_train2$pickup_latitude)-1, max(nyc_train2$pickup_latitude) + 1, length = 20))

# make grid a shapefile object as well
grid_sf <- st_as_sf(spat_pred_grid, coords = c("lon", "lat"), crs = st_crs(shape_sf))
grid_sp <- as_Spatial(grid_sf)

Warning messages:
1: In showSRID(uprojargs, format = "PROJ", multiline = "NO", prefer_proj = prefer_proj) :
  Discarded datum Unknown based on WGS84 ellipsoid in CRS definition
2: In showSRID(SRS_string, format = "PROJ", multiline = "NO", prefer_proj = prefer_proj) :
  Discarded datum WGS84 in CRS definition

# run variogram. This is where I think I have issues
trip_duration_vgm <- variogram(trip_duration~1, shape_df_cleaned)
trip_duration_fit <- fit.variogram(trip_duration_vgm, model = vgm(1, "Lin", 900, 1))

Warning message:
In fit.variogram(trip_duration_vgm, model = vgm(1, "Lin", 900, 1)) :
  singular model in variogram fit

# the plot seems sensible
plot(trip_duration_vgm, trip_duration_fit)

# finally try to Krige
trip_duration_kriged <- krige(trip_duration ~ 1, shape_df_cleaned, grid_sp, model = trip_duration_fit)

# Error here
> trip_duration_kriged <- krige(trip_duration ~ 1, shape_df_cleaned, grid_sp, model = trip_duration_fit)
Error in (function (classes, fdef, mtable)  :
  unable to find an inherited method for function ‘coordinates’ for signature ‘"Spatial"’
In addition: Warning messages:
1: In showSRID(uprojargs, format = "PROJ", multiline = "NO", prefer_proj = prefer_proj) :
  Discarded datum Unknown based on WGS84 ellipsoid in CRS definition
2: In showSRID(SRS_string, format = "PROJ", multiline = "NO", prefer_proj = prefer_proj) :
  Discarded datum WGS84 in CRS definition
3: In proj4string(d$data) :
  CRS object has comment, which is lost in output
4: In proj4string(newdata) :
  CRS object has comment, which is lost in output
So I obviously have some warnings and issues here but I am trying to understand why/what is going on. I am new to spatial-temporal analysis and have had a difficult time learning from my Professor. So I am just trying to learn from examples online and apply it to a real data set.
UPDATE:
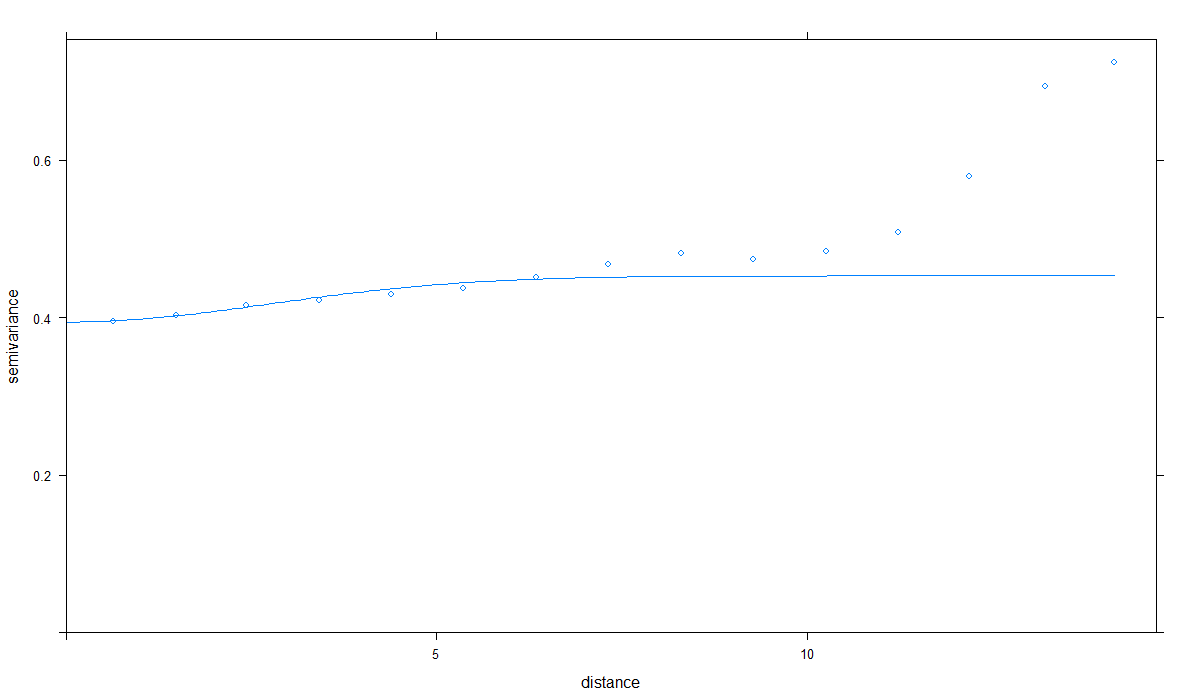
I changed my code slightly to get a fit using the sp package instead of sf. The result of my fit is below:
nyc_sf <- readOGR("geo_export_67813205-f2d6-435e-aa6e-3f7b691f154f.shp")
trip_data <- nyc_train2 # 5000 Taxi trips for March

# create grid for prediction
spat_pred_grid <- expand.grid(lon = seq(min(trip_data$pickup_longitude)-1, max(trip_data$pickup_longitude) + 1, length = 20),
                              lat = seq(min(trip_data$pickup_latitude)-1, max(trip_data$pickup_latitude) + 1, length = 20))
# give coordinates and make it a SpatialPoints object
coordinates(spat_pred_grid) <- ~lon + lat
gridded(spat_pred_grid) <-  TRUE
proj4string(spat_pred_grid) <- proj4string(nyc_sf)

trip_data_spatial <- trip_data
# make it a spatial object
coordinates(trip_data_spatial) <- c("pickup_longitude", "pickup_latitude")
proj4string(trip_data_spatial) <- proj4string(nyc_sf)

# join NYC shapefile to the trip data
trip_data_merged <- sp::over(trip_data_spatial, nyc_sf)

# complete the join
trip_data_spatial@data <- cbind(trip_data_spatial@data, trip_data_merged)

# make the model
trip_duration_vgm <- variogram(log(trip_duration)~1, data = trip_data_spatial)
trip_duration_fit <- fit.variogram(trip_duration_vgm, model = vgm(1,"Gau",100,1))
plot(trip_duration_vgm, trip_duration_fit)


vgm. However the estimate doesn't look great. I'll update my post with the picture of the fit. Also I performed the "kriging part" and it is working but it is running very slowly. $\endgroup$