The confidence interval is given by $$\bar{x} - c_{\alpha,n} \bar{\sigma},\hat{x} + c_{\alpha,n} \hat{\sigma}$$ where $c_{\alpha,n}$ is some constant that depends on the sample size $n$ and the confidence level $\alpha$.
The choice of this coefficient $c_{\alpha,n}$ will be based on the knowledge that the difference of $\bar{x}$ from the true mean $\mu$ divided by the estimate of the standard deviation will be following a t distribution.
So this thing $\bar{x} - c_{\alpha,n} \hat{\sigma},\bar{x} + c_{\alpha,n} \hat{\sigma}$ is the confidence interval. Your expression of $t$ is about the distribution of $\hat{x}$ relative to $\mu$.
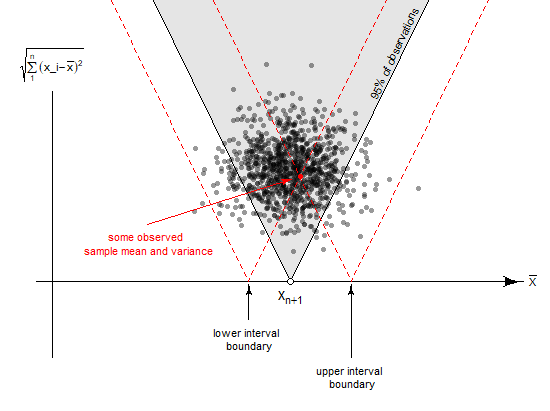
The image below gives a geometric interpretation to the construction of the confidence interval (that image is from this question which is about a prediction interval for $x_{n+1}$ but it is similar in the reasoning with a confidence interval for $\mu$)
You see in the image the sample distribution of the estimate of the mean (x-axis) and the estimate of the standard deviation of the mean (y-axis). The diagonal lines show a region in which 95% of the observations will be. If for a given observation (depicted in red in the image) you would choose a confidence interval based on those same diagonal lines in reverse then for 95% of the observations you will construct a confidence interval that contains the mean.
This construction is independent of the true mean $\mu$. For a different mean $\mu$ this cloud of observations will be shifted to the left or right, but the principle of the construction of the interval will be the same. It is all relative to the true mean. The distribution for the difference of $\bar{x}-\mu$ is independent $\mu$.


