0
$\begingroup$

I use both histogram and Normal Q-Q plot for the residuals of my regression.

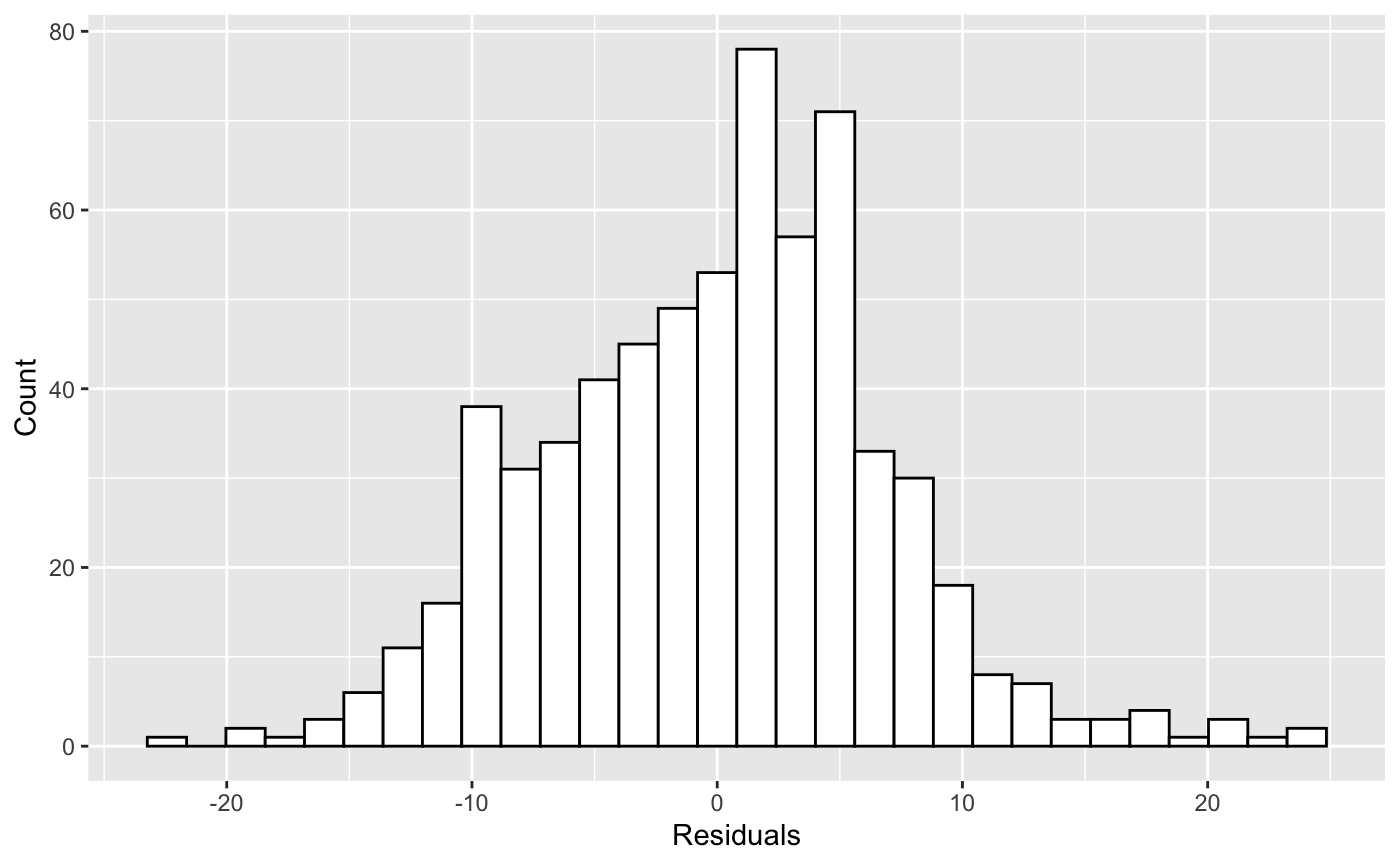
I would say that the histogram shows somewhat symmetric and the mean is around 0.

enter image description here

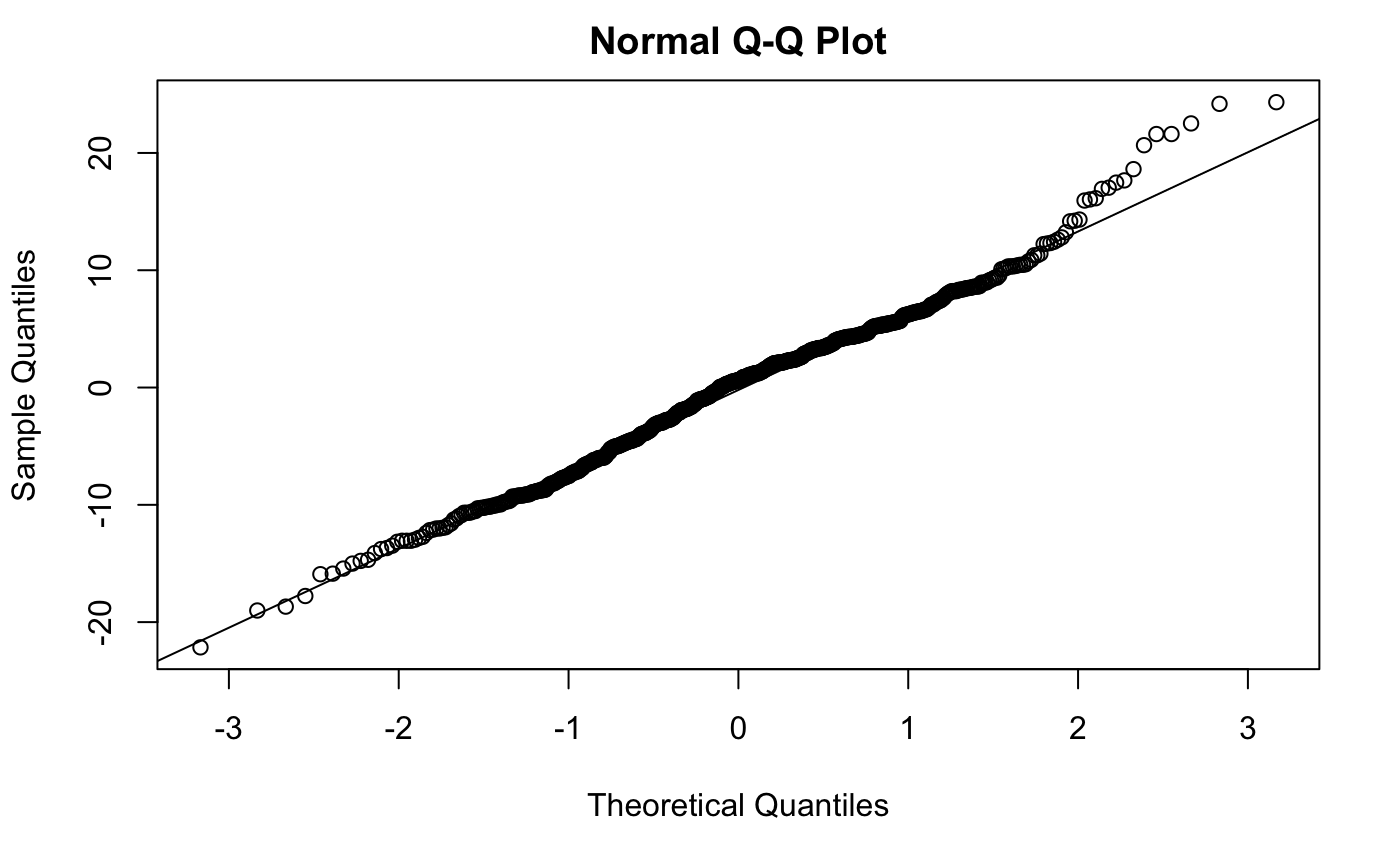
On a Q-Q plot, the points seem to fall along a straight line, with slightly longer tail on the right.

enter image description here

Therefore, I am not sure if it would be appropriate to consider the normality condition to be met. Anyone could provide some ideas on this?

$\endgroup$
4
  • $\begingroup$ You may use Kolmogorov Smirnov test or Shapiro Wilk test. See here for example. towardsdatascience.com/… $\endgroup$
    – TrungDung
    Commented Nov 23, 2020 at 20:57
  • $\begingroup$ I do use Shapiro Wilk Test and it shows that it is not normally distributed (p-value is very small). So, I think it is an issue. $\endgroup$ Commented Nov 23, 2020 at 21:12
  • $\begingroup$ How large the sample size? It says here that "if the sample size is sufficiently large this test may detect even trivial departures from the null hypothesis (i.e., although there may be some statistically significant effect, it may be too small to be of any practical significance)" en.wikipedia.org/wiki/Shapiro%E2%80%93Wilk_test. $\endgroup$
    – TrungDung
    Commented Nov 23, 2020 at 21:34
  • $\begingroup$ The sample size is 650. $\endgroup$ Commented Nov 23, 2020 at 22:20

0

Your Answer

By clicking “Post Your Answer”, you agree to our terms of service and acknowledge you have read our privacy policy.