I feel that after three years it does no harm to post my own answer to how I solved this problem. It could be the case I have made an error or two, so please use with a pinch of salt!
Following whuber's advice in the comments, since my data is a time series of heights we would expect a continuity of the height at the change-point (1980). So I recoded the data to be number of years from 1980, such that at 1980 it is 0, negative values are for dates prior to then and positive values post 1980.
Then I created two new variables: $before$ which contains the heights for the dates prior to 1980 and zero afterwards; and $after$ which contains the heights for the dates after 1980 and zero beforehand.
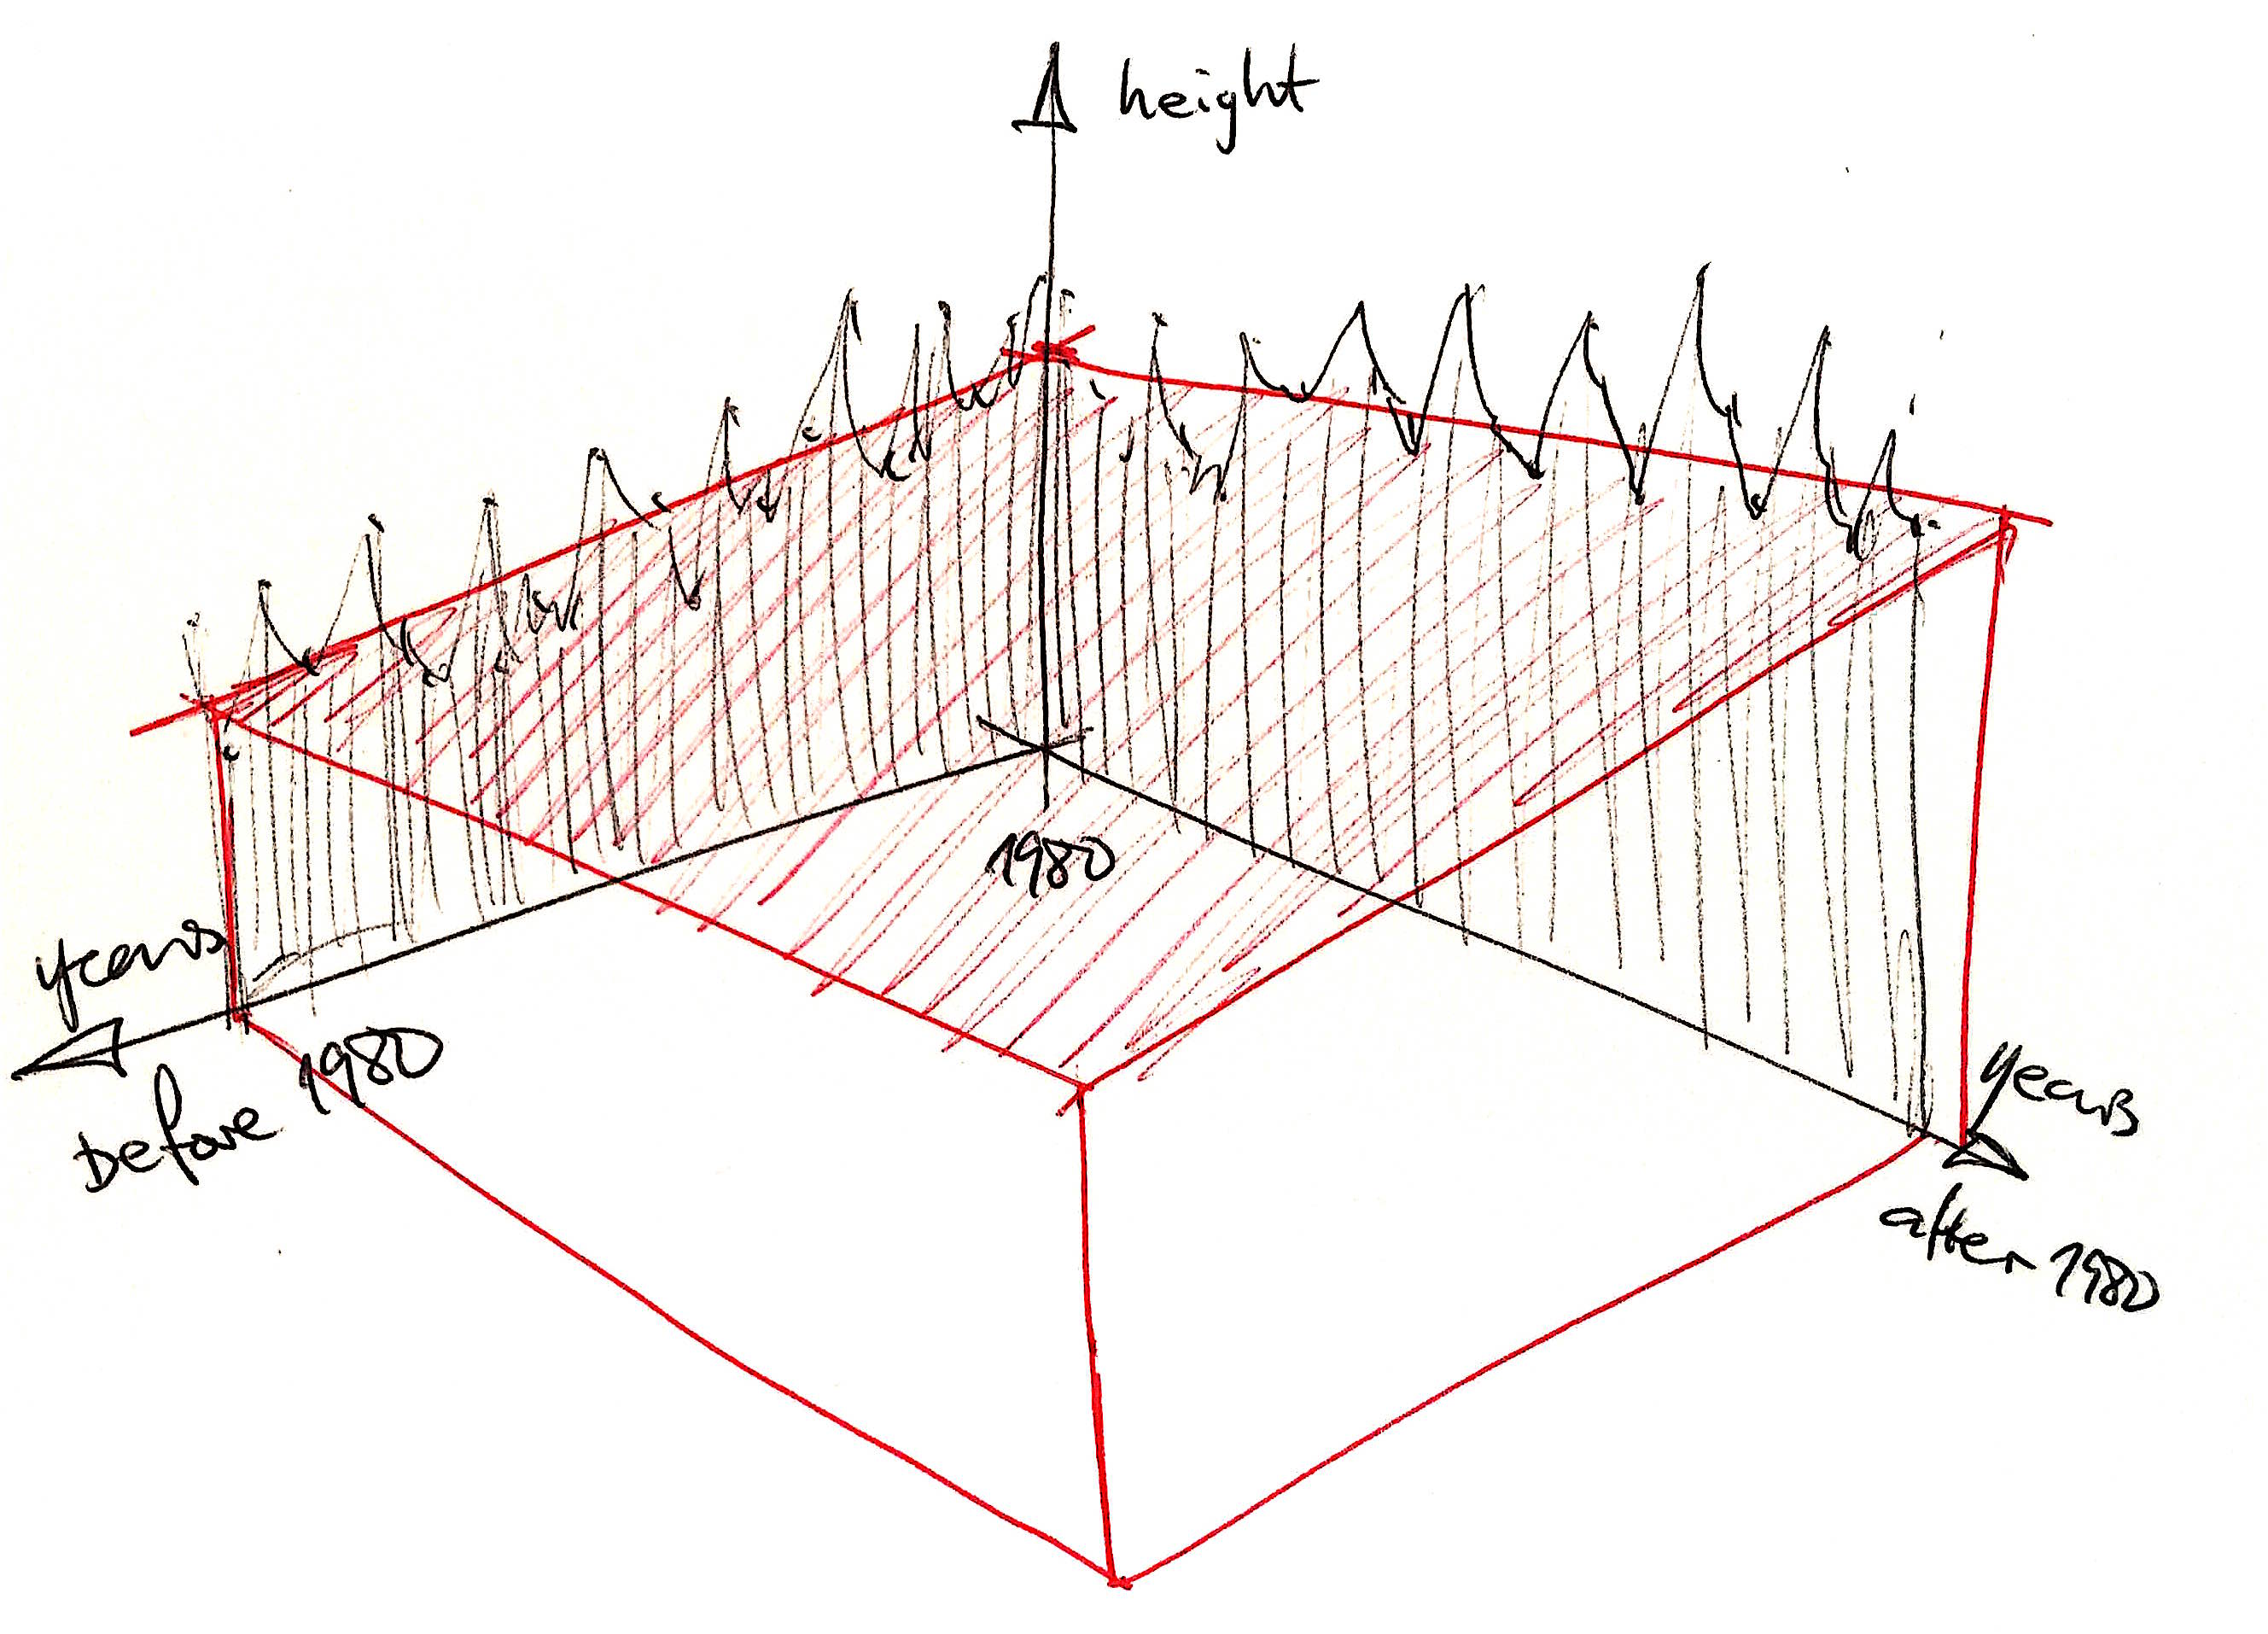
This means that I can view the data in the following way, with the intention of finding the plane of best fit.

Applying a multiple regression with these two variables as explanatory and height as response yielded the following:
$estimated\ height = 4.1\cdot before + 1.3\cdot after+7066$
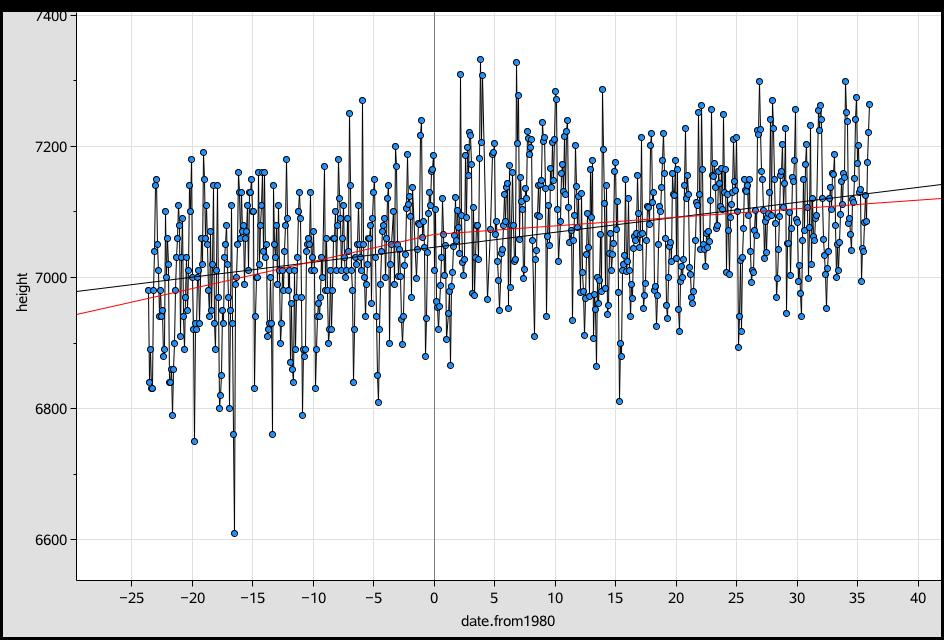
and looks like this:

where the black line is a regression on the whole data set whereas the red kinked line is the model above. So my original question now becomes whether this kink is significant, by asking whether there is a difference between the slope of before compared to the slope of after.
Assuming I can use the relevant statistics obtained from the multiple regression, I followed this response to compute the test statistic:
$Z=\dfrac{b_{after}-b_{before}}{\sqrt{SEb_{after}^2+SEb_{before}^2}}$
which with my values gives $Z=3.95$ and from there I can continue to calculate the $p$-value depending on the direction of the hypothesis. (In my case I hypothesised an increase, but that doesn't appear to be the case!)


