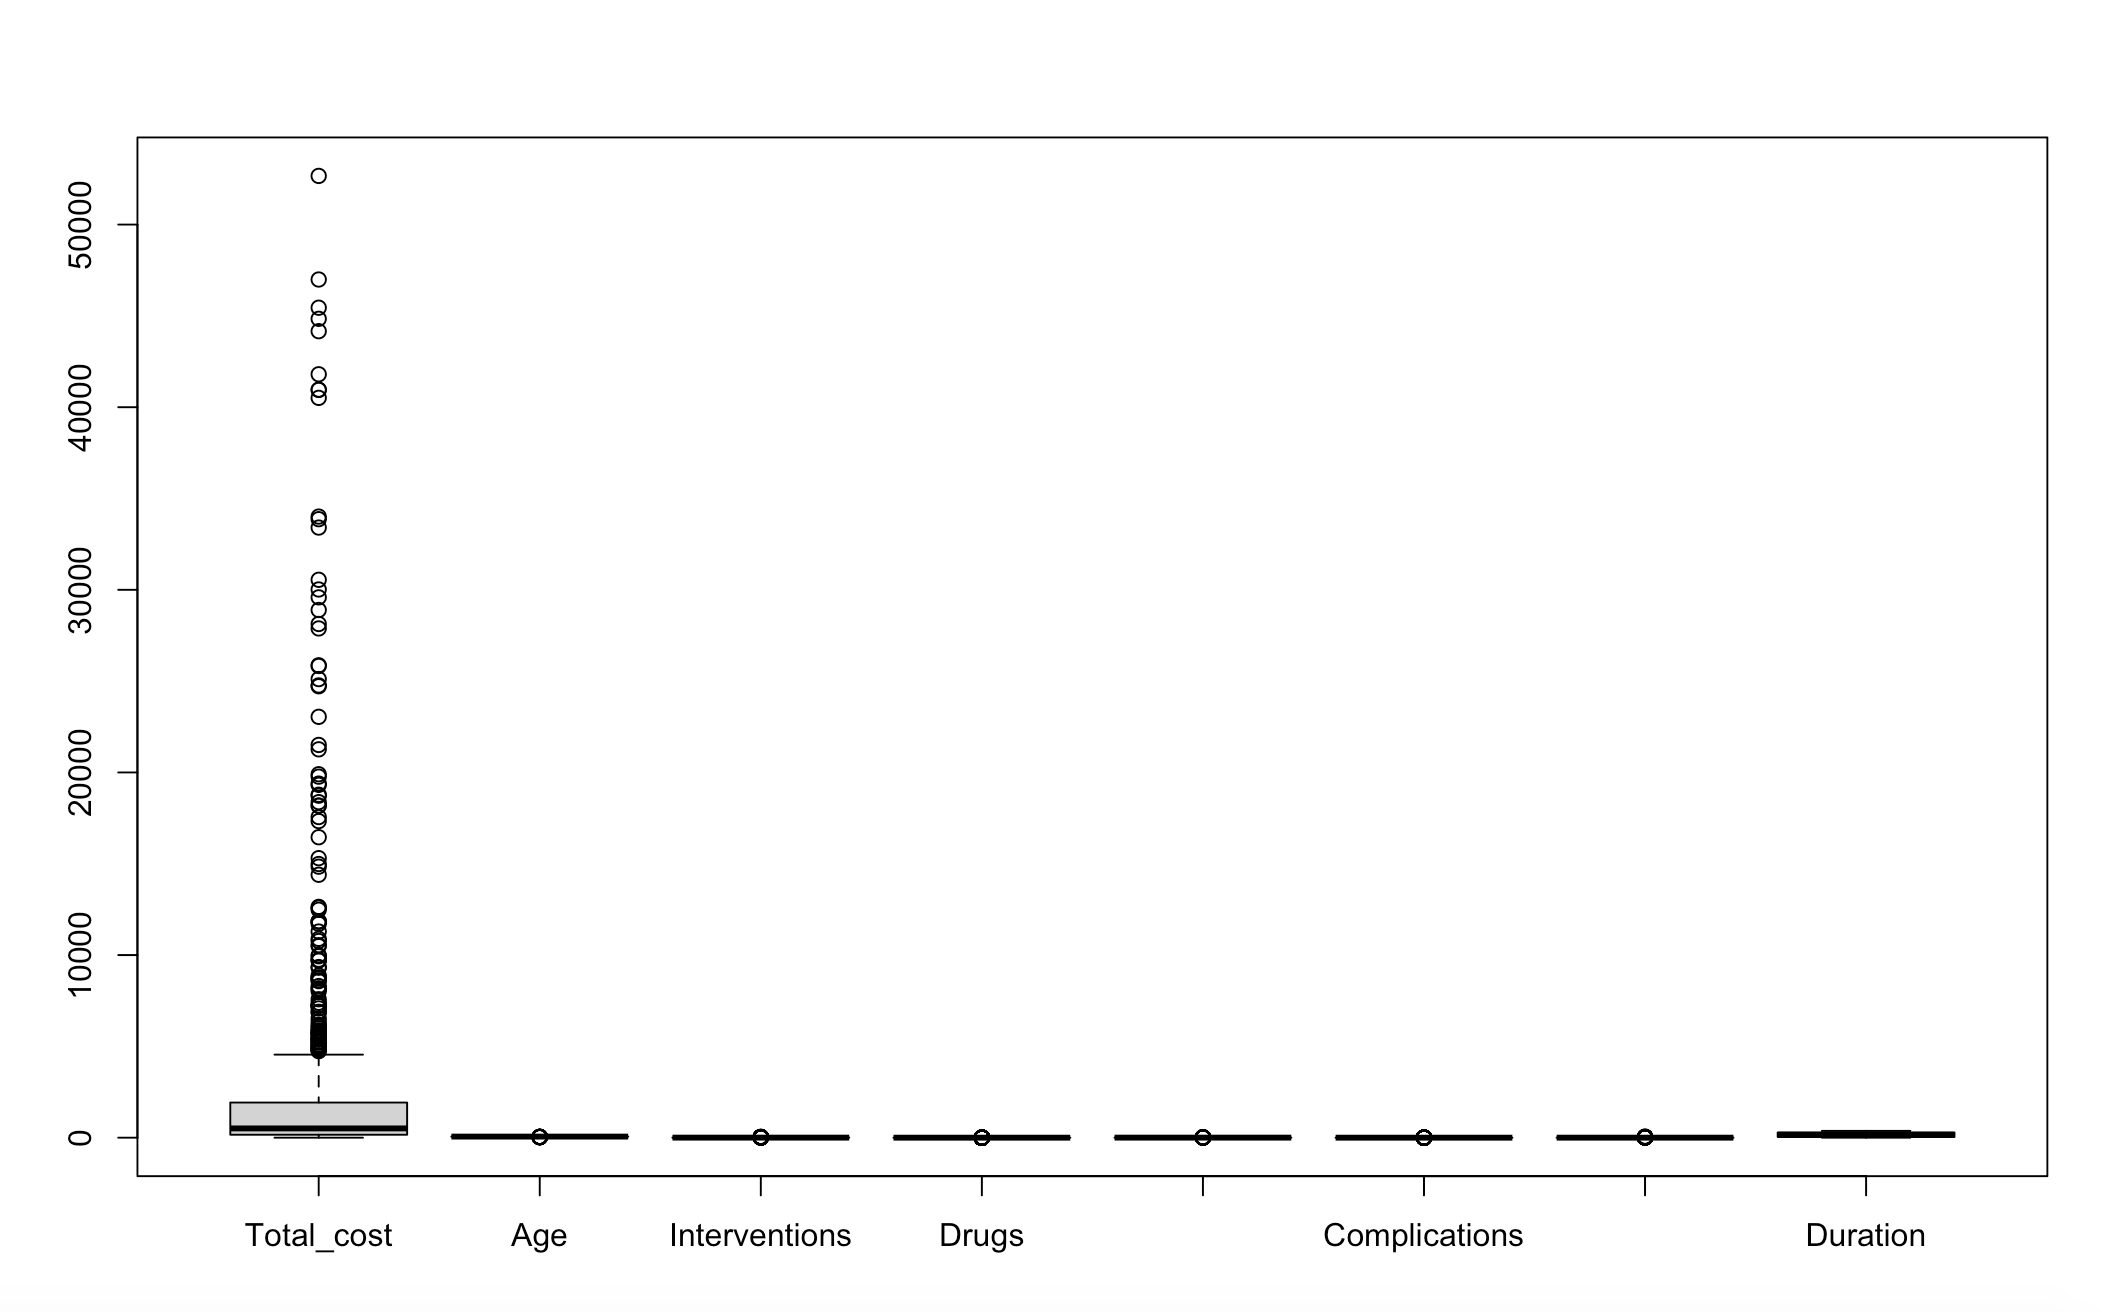
I am running a regression model, and I need to delete outliers. However, when I ran a boxplot, it asked me to delete at least 100 datas (I only have 700 datas in total). Both y and x variables are right-skewed distribution.
boxplot: (y is total_cast)
boxplot(data)
I did not delete anything and tried to run the model first. Only 2 variables' p-values are strong significant with three stars, another 3 variables have weak significant with only one star. R-squared is only 0.5, which is not good enough.
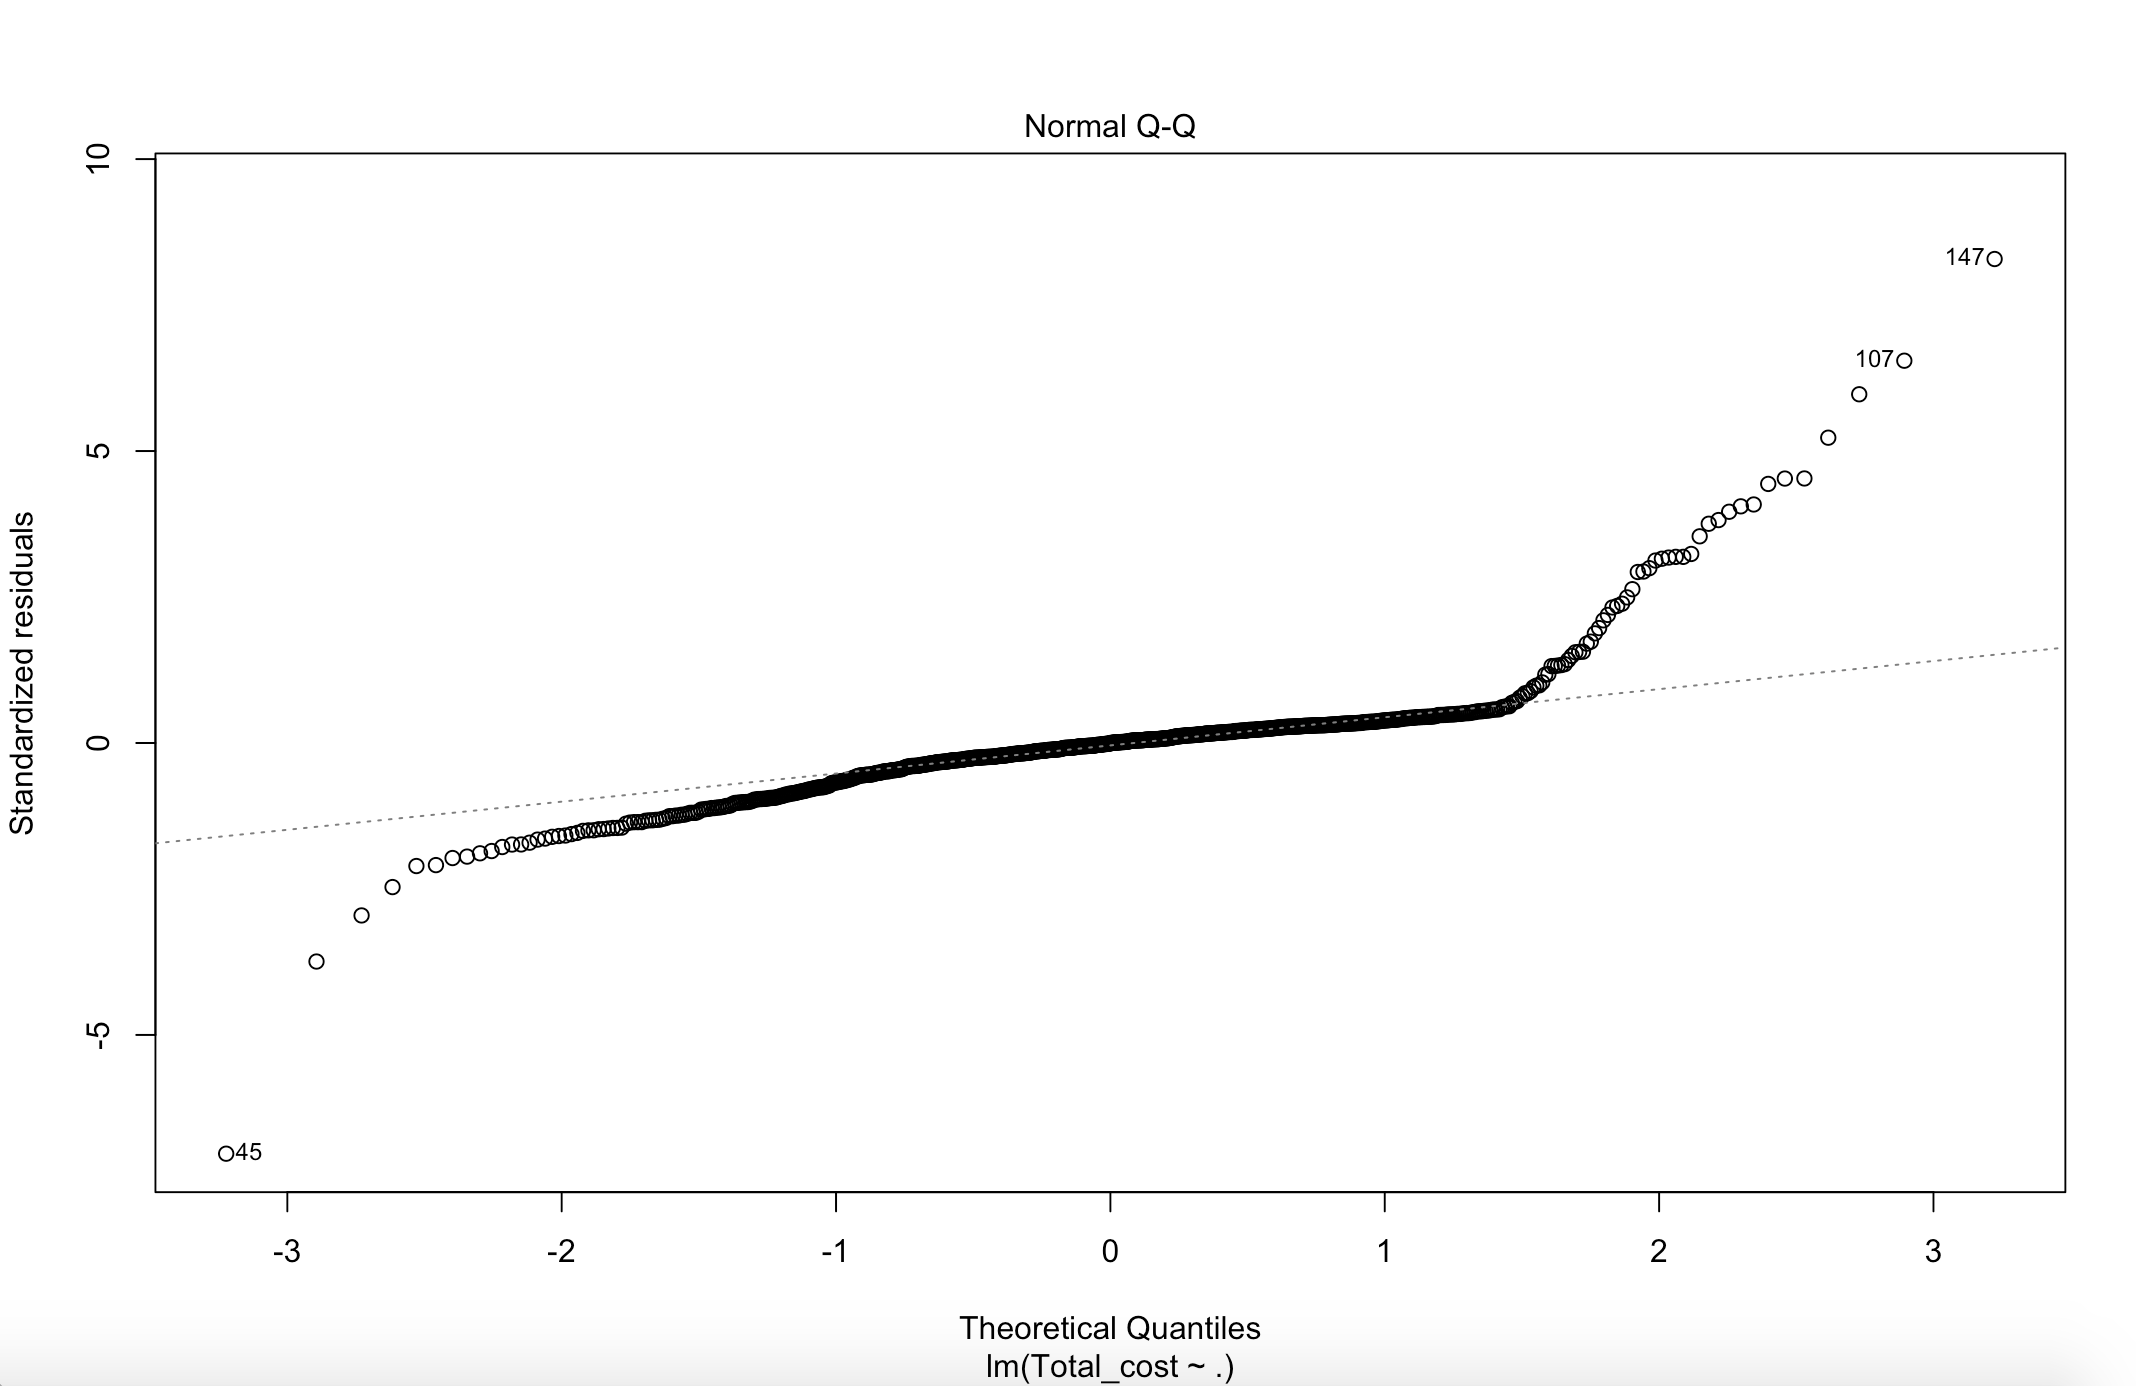
so I checked the plot:
plot(cost_model, which = 2)
Does this mean I only have to delete 3 outliers in this data? From row 45, row 107 and row 147? I do not understand what these number means and how to delete them.


Total_costis your dependent variable, you most likely should transform it or use a GLM. $\endgroup$