0
$\begingroup$

Suppose I have $X_{n} \sim MVN(\underline{\mu},\Sigma)$ where $n$ is large (several thousands). However, the $\mu_i's$ and the elements of $\Sigma$ are such that almost every simulation from $X_n$ yields a set of numbers that look like a Normal distribution of a specific mean and standard deviation say $Z \sim N(\lambda,\beta)$. Is there a term for $Z$?

For example, using R, I generate 10000 numbers from exp(1/20)

mu <- rexp(10000, 1/20)

Then, I use each of these numbers $\mu_i$ as a mean for one of the components of a MVN. For simplicity, I assume the components are independent and that the variance components are $\mu_i/100$

So, a single vector simulated from this MVN would be:

y<-numeric(10000)

for(i in 1:10000){
y[i]<-rnorm(1,mu[i],mu[i]/100)
}

Now I have a vector y that is one simulation from my MVN. What I am interested in is that when I look at the values in the y vector together (the 10000 components of the vector), they then resemble a univariate distribution.

Here is a sample graphic where I have three simulations of the y vector plotted as density curves. My question is that is it reasonable to study this curve and approximate it using some univariate distribution?

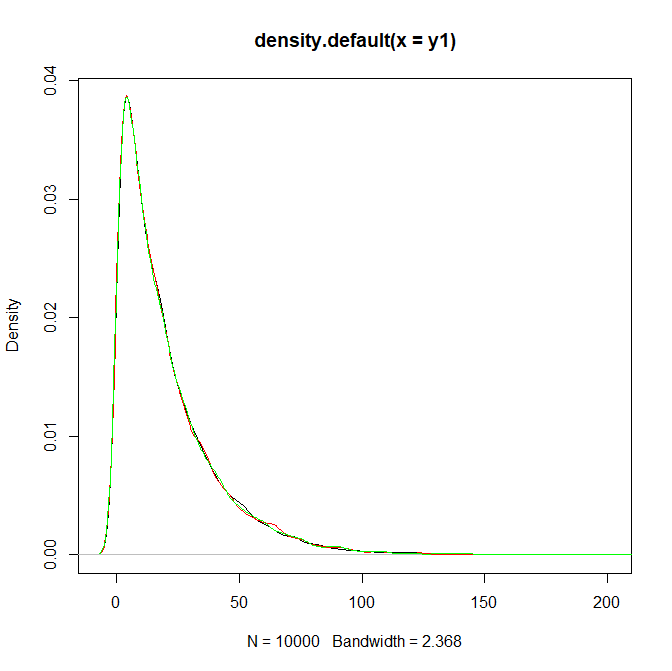
enter image description here

$\endgroup$
5
  • $\begingroup$ Do you mean that the coordinates of a random vector are almost iid? $\endgroup$
    – Xi'an
    Commented Jan 23, 2021 at 14:53
  • $\begingroup$ No, the components are different. However, the means are such that when you look at a histogram of the values in the $\mu$ vector, it looks like a single Normal. Also, the coefficient of variation for each component is small enough so that you are unlikely to generate values that depart so far from the center for each component. $\endgroup$ Commented Jan 23, 2021 at 15:02
  • 1
    $\begingroup$ Could you please explain how a simulation of a sequence of multivariate values produces a "set of numbers"? Currently, it is impossible to determine whether you are looking at all the components or somehow taking averages. $\endgroup$
    – whuber
    Commented Jan 23, 2021 at 18:36
  • $\begingroup$ So when you simulate for a MVN of length n, you get a number for each of the n components, right? A vector of length n. What I am interested in is that when you look at the components of those vectors, they form something that you can fit some density function over. $\endgroup$ Commented Jan 23, 2021 at 19:05
  • $\begingroup$ @whuber I already edited the question as you instructed. Can it be reopened? $\endgroup$ Commented Jan 24, 2021 at 11:45

0

Your Answer

By clicking “Post Your Answer”, you agree to our terms of service and acknowledge you have read our privacy policy.