5
$\begingroup$

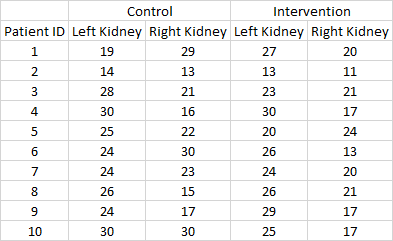
I have a simple setup. I have 10 patients and I would like to test the effect of a certain drug on kidney function. Each patient will serve as his own control and intervention.

First for the control observations, the baseline left kidney function and right kidney function are measured for each patient.

Then once the intervention is introduced, the left and right kidney function of each patient is measured again.

In order to determine the effect drug, I am looking for significant differences between the intervention and control measures.

The values in the table above are fictitious and are meant to provide clarity.

I technically have 20 paired observations, however they are not independent. There are two paired observations per patient and these are inherently correlated.

I could take the average of the left and right kidney functions, before and after the intervention. Then I would just have 10 paired observations, and I could carry out a simple paired samples t test.

Is there another way I could find significant differences without averaging or throwing away data? I would like to keep these repeated measures. Is there a way I can take their dependency into account?

I've looked up repeated measure ANOVA, but I'm not sure if that's what I need. Do I need to use a linear mixed effect model?

Note: If I do a paired t test as if they were 20 independent paired observations, my result is statistically significant p<0.02. If I average left and right and use 10 independent paired observations my result is not statistically significant, with p>0.10.

$\endgroup$
2
  • 1
    $\begingroup$ Just to clarify - the "control" group is the baseline measurements (both kidneys) in the control group (all patients), and the "intervention group" is the post-intervention measurements (both kidneys) in the intervention group. So all patients were measured 4 times: twice at baseline, and twice after the intervention. All patients received the intervention. Is this all correct ? $\endgroup$ Commented Feb 25, 2021 at 8:20
  • $\begingroup$ @RobertLong Yes that's correct! What kind of ANOVA or model should I be doing? $\endgroup$
    – teeniv
    Commented Feb 25, 2021 at 11:11

1 Answer 1

6
$\begingroup$

This is basically an analysis of change model.

2 measurements on each subject were taken at baseline, and 2 more at follow-up. I will refrain from calling this "control" and "intervention" as that could be somewhat misleading.

We have repeated measures within patients. So we could consider a model that fits random intercepts for patients, to control for this. There are also repeated measures within each kidney of each patient. I would suggest the following model:

measure ~ time + LR + (1 | PatientID)

In order to fit this model, it is necessary to "reshape" the data as follows:

PatientID   time   LR   measure
1          -0.5    L    19    
1          -0.5    R    29
1           0.5    L    27
1           0.5    R    20
2          -0.5    L    14    
2          -0.5    R    13
2           0.5    L    13
2           0.5    R    11

The estimate for time will answer the research question: What is the change in measure associated with the intervention, while controlling for the repeated measures within patients, and within the same kidney's of each patient.

Another approach is to fit nested random effects, and treat LR as a random factor:

measure ~ time + (1 | PatientID/LR)
$\endgroup$
22
  • $\begingroup$ Thank you for your answer Robert. By reshaping the control/intervention nature of the measurements, the 'time' variable you have made is ordinal, right? But shouldn't it be categorical in nature? $\endgroup$
    – teeniv
    Commented Feb 25, 2021 at 21:08
  • 1
    $\begingroup$ You're welcome. When there is only 2 timepoints it won't make any difference. $\endgroup$ Commented Feb 25, 2021 at 21:18
  • $\begingroup$ I think I should be able to fit a mixed model to either of the approaches you mentioned. Some final questions- is there a a subtype of ANOVA that I could also use to arrive at the same? Also I have never heard of analysis of change, could you point me in the direction of some good litereature? $\endgroup$
    – teeniv
    Commented Feb 25, 2021 at 21:29
  • $\begingroup$ "Analysis of change" is just a term used to describe a study where you are interested in an outcome that changes over time, so it's quite common. Googling <"Analysis of change" regression> gives about 52 million results. Most of the references I know are paywalled, but here is a recent one that isn't (and the other references I know are all referenced therein) arxiv.org/pdf/1907.02764.pdf $\endgroup$ Commented Feb 25, 2021 at 21:53
  • $\begingroup$ As for ANOVA, if you make time categorical in the above model, you are fitting a repeated measures ANOVA (and the results should be the same) $\endgroup$ Commented Feb 25, 2021 at 21:55

Your Answer

By clicking “Post Your Answer”, you agree to our terms of service and acknowledge you have read our privacy policy.

Not the answer you're looking for? Browse other questions tagged or ask your own question.