Hello while I can not show you my code, as it is confidential due to company legal agreement, I developed a Genetic Time Series fitting VAR in levels, VECM, and VAR in differences and doing a kmeans cluster analysis afterwards for narrowing down solution space for the Genetic Algorithm, as you can run my tool with an overall search grid for all features and parameters, and then use insights from the kmean to adjust the params of every single feature. I worked 4-5 months on it and I can say that I swallowed a lot of theory and coding strategy e.g. syntactic sugar and how to save chromosome solutions of the GA, which hold the solutions for all VAR submodels.
So I have some experience. Maybe it would be better to go to chat if you want to know more in detail.
I have non overlapping windows, as i do a rolling forecast with a window-size only of one that rolls forward 52 weeks but one week at a time. So we have a 52 weeks forecast which is originally a 1 week fit, as the shortest window guarantees the best fit. This is our strategy to mimic a one year forecast.
Imho, the RMSE is limited in its answers. For business implications you'll need R² and MAPE/MAE, with train/test split, as the RMSE is useless for other stakeholders. I myself would stick also to the MASE of Rob Hyndman, as it can also tell you the fit of a time series that can drop to zero (intermittent demand time series). And the MASE tells you if your forecasting method is better than the most naive forecast there is, in other words, this week equals last week.
I can not tell you anything about your RMSE questions, but it belongs to the point of view. I mostly work in the area of media/ads/ad awareness kpi sales, and no one would understand rmse. So I develop models, that everyone can get into.
Update
As the OP asked of a more general matter, I updated my question:
Dear Peter, that is an excellent question and indeed it depends more on the nature of your data points. And I'll give you an excerpt from my forecasting tool in the shape of an output matrix to answer this question.
First lets get some terminology:
-when im talking about window size, i mean reevaluating data or making the training set bigger at each iteration. The iteration is determined by the forecast period. e.g. 52 weeks measn 52 iterations of window size 1
-when im talking about nahead i mean how many windows you want to forecast at once despite your refitting. it is possible to forecast e.g. 2 windows although you are only incorporating information of only window1.
-when we are observing every iteration we normally speak of APE! Absolute Prediction Error, MAPE Only if there are more than two observations to have the mean of them.
That means you get RMSE/MAPe in dependence of window size (also knowns as crossvalidation of time series https://otexts.com/fpp2/accuracy.html) and forecasting period. The red dots are the windows.
For example, have a look at the output of my VAR. I want to forecast a period of 52 data points. So you can imagine tha this matrix has a format of 52 rows.
I have a forecasting window of 2, that means I'm forecasting from my actual point of time that is t - 1 (some would say its t, because I want to forecast now, but that doesnt matter) . So I want to forecast t. However with a window of 2 n.ahead I also forecast t + 1.
First,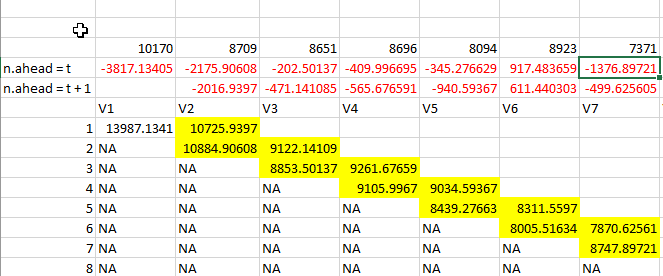 we have a look at that matter before dealing with the cross validation. In theory, the best forecast we can get, is the shortest, thus: If your data is of 99 time periods or of 1000 a forecast of only t would result in better results in theory:
Also look here, why we are normally not doing something on the whole time series:
https://www.youtube.com/watch?v=kgBDQ3baESw
But as you can see from my data an n.ahead t + 1 could be sometimes better at V6 and V7. Because the time series at V4 thinks we may get a rising value due to 8696 which is not the case (8094), resulting in bad predictions for V5 but better predictions for V6, since we have a two window prediction, the V7 prediction for V6 is better since we now incorporate the falling trend of 8094(V5, original) in the train set of (results in 7870 which is better for the falling trend of 7371. The quintessence is, that it is dependent of the datapoints.
I always talked about incorporating, because in theory I still revalidate my model at every prediction with a window size of 1. Although sometimes a 2 window size reevalutaion would be better. But I'm talking about a big automation process, It would be easy to implement and to look at which is the better forecast for a varying of windows.
Now lets have a look at your questions:
My question is whether I should calculate the MAPE/MAE/MSE of each
prediction iteration which leads to 2 different RMSE or whether I
should store all predicted values and calculate only 1 MAPE/MAE/MSE
for the whole time series?
The question for me is more about do you want to forecast the 2 periods at once or step by step. Because this mainly influence the MAPE APE as you can see from my data.
You can do both, and more: But it should not end up like in the video, thus:
1.) You can calculate the difference between observed and predicted value in every iteration just as in the matrix. Then you can calculate a MAPE over your whole prediction/observations. This results in a forecast, refitted or reevaluated at a window size of 1!!!!! and a forecasting period of 2 periods, since you have two values. Although you might get 2 RMSE APE at the first and second observation we ignore the first, it is incorporated in the overall fit.
2.) You can also forecast 2 weeks ahead with a window size of 1 that would result in an average forecast window as you can do something like this:
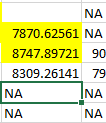 But that would also result in one RMSE or MAPE.
As you can see from my data, I have RMSE at every point, but I'm interested in the overall fit, when using a specific window size (1) and forecasting period (1 or 2). So when you are giving one RMSE you always tell the window size, and n.ahead (or t + n ) at which the data was measured imho. If your n.ahead and window size is greater than 1 e.g. 2 Than I would tell both RMSE.
Further I would like to know if the total MAPE/MAE/MSE in this case
would be equal to the average MAPE/MAE/MSE of the individual
prediction iterations?
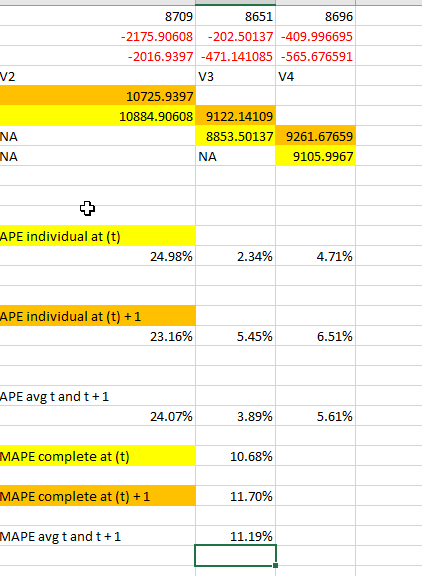
And from what we have seen, you can derive that the avg should normally not be the same. See Image: If there is still something I got wrong, please tell me, because I invested nearly over an hour to get all together ^^
Update 2
I'm answering the quesions of the OP as it seems I had not not thoroughly reasoned my answer (which is correct), thus Np Peter I'm here to clarify everything.
- I have a forecast of 2 yes. Atm always. That means Im forecasting two weeks at once from my specific point of time. Looking at the matrix that means: I'm in week 2 and forecast week 2 (V2) and the next week (V3). I have only 2 because one method in the vars package in R only allows a forecast horizon of at least 2 when using dummy variables. If I could, I would use 1, thus forecast V2. However, as you can see from my matrix this is no measuring problem. Because although I forecast two weeks, I always ignore the latter. That leads to a forecast of 1. So yes Im using 2 but I would advise to use a forecasting week of 1, for simplicity so far.
2.) to understand the size of my data you have to remember window size is not the forecasting period of 2. Window size comes from cross validation in time series and it means, window size is the size of the sliding window, thus if my data consist of 152 e.g. I would start at 100 weeks training data and forecast week nr. 101 and 102 (forecast 2), then with window size == 1 in the next iteration I have 101 training data with window size == 1, I forecast 102 and 103, and so on. Thus I got 2 APEs, but I only use one (However it would be possible to use both and I would get a MAPE of two weeks forecast 2). Although it seems I have overlapping windows, I only use the actual forecast of the curent week.
- V1 to V7 are forecasted Units on Week 1 to 7, the rows also reflects weeks. The reds are rrors. Above the reds are real values of units not the forecasted units. normally I would have a diagonal line like in correlation analysis. That would by the way reflect window size = 1 (reenlarging training set by 1) and forecasting = 1. But as I have forecast = 2 I have a double sized diagonal line. Red value in line "n.ahead = t" is the error of the forecasted Unit value in the actual week.
(Week 2 forecast 10884-8709 Actual value for week2) = -2175.
But If I'm in week 1 (V1) and want not only to forecast week1 the line with "n.ahead = t" but also n.ahead t + 1 thus week 2, I would look at the error of -2016 = 8709-10725. It means I can forecast the week of 2 when I'm still in Week 1. The first one with -2175 was I already forecasted week one, now i want to forecast week 2, because I'm actually at week2. SO the answer to your question is just a pure YES!
There are differences in calculations as you can see below in calculating MAPE and APE. I would say in the end it is different but it wont matter that much as you get always different results as you can see in the last image. Or to be concrete when you do individual forecasts APE you would end up with 24.98%, 2.34 and 4.71, these are you APE at every prediction the Mape is near 11. Due to your rolling window and forecast your APE can change dramatically between every week. But in terms of MAPEs it wouldn matter so much. As we average all of it. But it is still never the same value.
You are right as I would have normally taken 1, as it is the best short term.But I use 2 because its a technical limitation of a package i circumvent that only with the matrix, thus that may be the main root of confusin i induced when talking about n forecast of 2. But as you already know i can refit my train data every week but I could forecast 2 or 3, 4 weeks in advance if I want. If this is useful or not depends on the data and the information. as you can see a data point at time point t may has good information for time point t + 1 but not for t + 2 or vice versa. So you have to be really aware of what you are doing.
APE(t):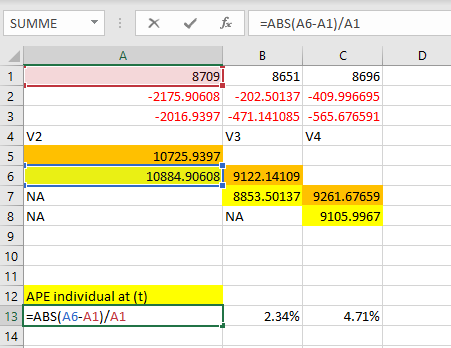
APE(t+1)[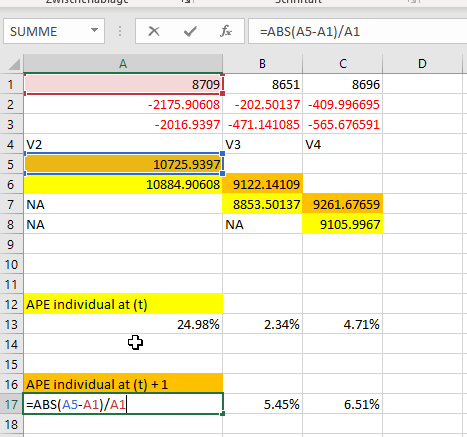
MAPE (t)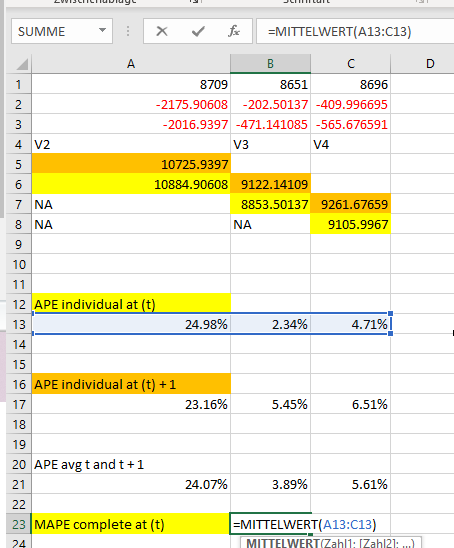
You find all the values in the matrix.
The rolling window mentionend in 1) and 2) has to be calculated in a loop. R wont enlarge your training set. But the RMSE is in the forcast library by rob hyndman namely this function:
forecast::accuracy(
as.ts(train.set),
test.set
)


