Here are fake data. First with data analogous to your logged data.
My purpose is to illustrated @stats_model's comment. The Wilcoxon
test cares only about the ranks of your data which are not changed
by monotone transformations.
set.seed(2021)
b = rnorm(15, 5, .6)
g = rnorm(16, 6, .65)

wilcox.test(b,g)

        Wilcoxon rank sum test

data:  b and g
W = 66, p-value = 0.03305
alternative hypothesis:
 true location shift is not equal to 0
Second with data analogous to your original un-logged data.
Notice that the P-value is exactly the same either way.
B = 10^b; G = 10^g
wilcox.test(B,G)

        Wilcoxon rank sum test

data:  B and G
W = 66, p-value = 0.03305
alternative hypothesis:
  true location shift is not equal to 0
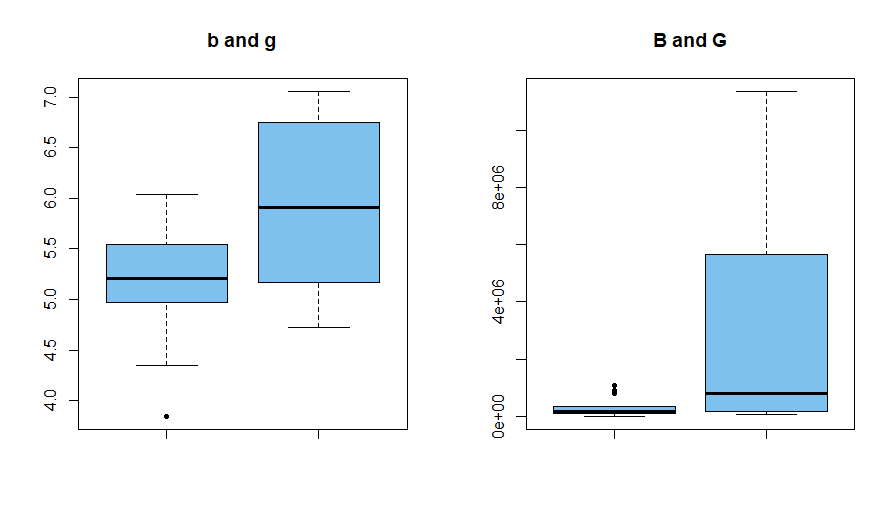
Here are boxplots of your data:
par(mfrow=c(1,2))
 boxplot(b,g, col="skyblue2", pch=20, main="b and g")
 boxplot(B,G, col="skyblue2", pch=20, main="B and G")
par(mfrow=c(1,1))

However, results are very different with Welch t tests.
Because I simulated b and g to be normal data, the first
test is accurate. But the second, is using nonnormal data
so the P-value should not be taken seriously. Also, the Welch
test reduces the degrees of freedom in the second test to
account for extremely different variances between B and G.
t.test(b,g)

        Welch Two Sample t-test

data:  b and g
t = -2.7628, df = 27.238, p-value = 0.01015
alternative hypothesis: true difference in means is not equal to 0
95 percent confidence interval:
 -1.2258077 -0.1812623
sample estimates:
mean of x mean of y
 5.198991  5.902526

t.test(B,G)

        Welch Two Sample t-test

data:  B and G
t = -2.6203, df = 15.24, p-value = 0.01911
alternative hypothesis: true difference in means is not equal to 0
95 percent confidence interval:
 -4745427.1  -491396.2
sample estimates:
mean of x mean of y
 307345.8 2925757.5


