1
$\begingroup$

I'm in desperate need of advice in terms of the choice of statistical test for my analysis.

Briefly to explain what I am analyzing in an animal model: I want to see the effect of 2 categorical variables ("genetic_profile" and "sex") and "age" variable (recorded in exact days which vary between subjects but the data is generally split into 3 and 9 months-old) on the continuous variable - "measurement". There are 52 measurements (24 come from paired animals - i.e. measure was taken twice in 12 out of 38 animals). The measurement was taken using a program that displays processed brain images and two points were selected manually to measure the thickness of a small anatomical feature.

Outcome variable: measurement

Predictor variables: genetic_profile (mutant/wild-type), sex (female/male), age (in days),

This is the model in R (also accounting for a possible interaction between genetic_profile and age). The random effect comes from animal.

model = lmer(measuremnet ~ Genetic_profile*Age + Gender + 
        (1 | animal), data = data_set)

I attached a picture of a plot of residals vs fitted (plot(model))enter image description here and it definitely does not look like the right fit (residuals form 3 parallel stripes across the plot).
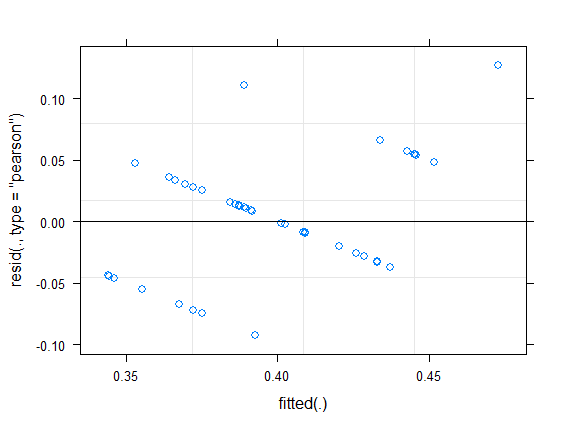
I believe it's important to mention that measurement has presumably a large degree of error since the precision measure was to just 1 decimal place and essentially all measurements that were recorded were between 0.3 and 0.5 (differed by 0.1, 0.2 or 0.3 mm at most).

Should I try and find a way to apply this model or was the suggestion wrong? I presume that a t-test should be applied if the linear mixed model is incorrect?

$\endgroup$
5
  • $\begingroup$ Your measurement variable is some sort of scale, isn't it? These sorts of residuals are observed when you do a linear regression on say likert data. Can you tell us more about the outcome? What is it, what is it measuring, how is it performed? $\endgroup$ Commented Apr 22, 2021 at 23:32
  • $\begingroup$ Thank you for your reply! What I'm measuring is the thickness of a small anatomical feature on images. Almost all collected data fits between 0.3 and 0.5 mm (and precision is to just 1 decimal place). This may be a reason why it appears as a scale although it actually isn't. $\endgroup$
    – Ala Czesik
    Commented Apr 22, 2021 at 23:42
  • $\begingroup$ If your outcome consists of 0.3, 0.4, and 0.5 then the noise in the data is decidedly not normal. You'll need to think of a different approach. Can edit your question with as much detail on how the outcome is measured as you can? Are you rounding the outcome, or is a machine rounding the outcome? $\endgroup$ Commented Apr 22, 2021 at 23:58
  • $\begingroup$ Thank you! I've edited the post and I hope it explains it a bit better. So I'm taking the measurement by manually selecting 2 points in a program that displays the image and the program itself is responsible for rounding it. Unfortunately, I couldn't find a way to increase the precision and I have to complete the analysis with this dataset. $\endgroup$
    – Ala Czesik
    Commented Apr 23, 2021 at 0:13
  • $\begingroup$ 0. Welcome to CV.SE. 1. You might want to consider consider your response being ordinal rather than continuous. $\endgroup$
    – usεr11852
    Commented Apr 23, 2021 at 1:27

2 Answers 2

2
$\begingroup$

If I understand your description of your data, you have 52 observations (rows in your dataframe) and you try to fit a model with 7 parameters (intercept, variance of the random effect, general variance, 3 parameters for the interaction and one parameter for the age). As a rule of thumb, it is recommended to have between 20-30 observation per parameter. It is even more important when you expect to observe weak effect or a lot of variance in your outcome variable. I think that your biggest problem here is to fit a too much complicated model with not enough data.

$\endgroup$
2
  • $\begingroup$ Hello Jeremy, thank you for your reply! Yes, I believe that your understanding sounds exactly right. Do I understand correctly that since I have 52 observations it does fulfill the rule as that's above 20-30? However, since the difference between the measurements is relatively small or virtually none (as almost all recorded were: 0.3, 0.4 and 0.5 mm), it means that there is not enough precision and that dataset is also not big enough to fit it into such model? $\endgroup$
    – Ala Czesik
    Commented Apr 23, 2021 at 0:21
  • $\begingroup$ Well, your model has 7 parameters to estimate (one intercept, 4 coefficients, one population variance, and one variance for the random effect), so you would need at least around 140 - 210 (7*20 - 7*30) observations to be at least a bit confident with the results (or even for the model to converge) according to this rule of thumbs. Moreover, you use a mixed model which requires generally even more observations. If you can not gather more data, you will have to use a less complicated model. $\endgroup$ Commented Apr 23, 2021 at 0:55
2
$\begingroup$

Your measurement processes is incompatible with linear regression. Given that your computer program rounds the measurement, and given the latent measurement is so low variance that it falls within 3 buckets, my recommendation is to reconsider the model likelihood and perform an ordinal logistic regression.

Jeremy raises a good point that you have a problem with your parameter budget. 52 observations (assuming the 1 in 10 rule for binary logistic regression, which has been shown to be very liberal and in fact any such rule would require many more observations per parameter) would allow you to adjust for 4 additional parameters.

You should strongly rethink rethink how to approach the model, starting with the likelihood.

$\endgroup$

Your Answer

By clicking “Post Your Answer”, you agree to our terms of service and acknowledge you have read our privacy policy.

Not the answer you're looking for? Browse other questions tagged or ask your own question.