13
$\begingroup$

I am new in this field of Machine Learning. From what I get by the definition,

Bias: It simply represents how far your model parameters are from true parameters of the underlying population.

$$ Bias(\hat{\theta}_m) = E(\hat{\theta}_m) − θ$$

where $\hat{\theta}_m$ is our estimator and $\theta$ is the true parameter of the underlying distribution.

Variance: Represents how good it generalizes to new instances from the same population.

When I say my model has a low bias, it means by model parameters are very similar to the true underlying parameters that generated the population. So it should also generalize well to new instances from the same population. So how it can have a high variance?

$\endgroup$
1
  • $\begingroup$ low bais and high variance is a long term for 'overfitting' $\endgroup$
    – Haitao Du
    Commented May 6, 2021 at 5:37

4 Answers 4

19
$\begingroup$

The key point is that parameter estimates are random variables. If you sample from a population many times and fit a model each time, then you get different parameter estimates. So it makes sense to discuss the expectation and the variance of these parameter estimates.

Your parameter estimates are "unbiased" if their expectation is equal to their true value. But they can still have a low or a high variance. This is different from whether the parameter estimates from a model fitted to a particular sample are close to the true values!

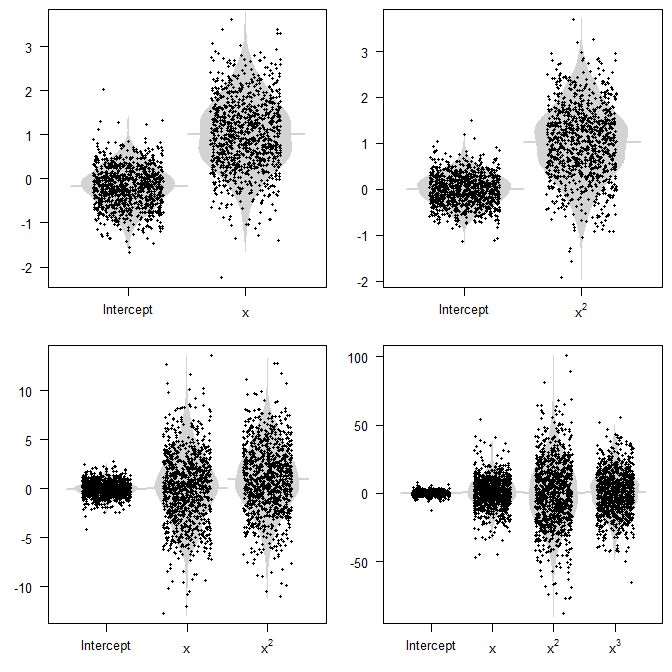
As an example, you could assume a predictor $x$ that is uniformly distributed on some interval, say $[0,1]$, and $y=x^2+\epsilon$. We can now fit different models, let's look at four:

  • If we regress $y$ on $x$, then the parameter will be biased, because its parameter will have an expected value greater than zero. (And of course, we don't have a parameter for the $x^2$ term, so this inexistent parameter could be said to be a constant zero, which is also different from the true value of $1$.)
  • If we regress $y$ on $x^2$ alone, our model is the true data generating process (DGP). Our parameter estimate will be unbiased and have minimum variance.
  • If we regress $y$ on $x$ and $x^2$, then we have the true DGP, but we also have a superfluous predictor $x$. Our parameter estimates will be unbiased (expectations $0$ for the intercept and the $x$ coefficient, $1$ for the $x^2$ one), but they will have a higher variance.
  • Finally, if we regress $y$ on $x$, $x^2$ and $x^3$, the same holds: we have unbiased parameter estimates, but with an even larger variance.

Below are parameter estimates from 1000 simulations (R code at the bottom). Note how the point clouds cluster around the true value (or not), but also how spread out they are.
bias_variance

The conceptual problem is that we usually don't see these random variables. All we see is a single sample from our population, and a single model, and a single realization of our parameter estimates. This will be one of the dots in the plot. The key thing to keep in mind is that if our model is misspecified, then variances will be larger. And of course, if we have large variances, then our model can easily be very far away from the true DGP, and be very misleading, whether we do inference or prediction.

R code:

n_sims <- 1e3
n_sample <- 20

param_estimates <- list()
param_estimates[[1]] <- matrix(nrow=n_sims,ncol=2)
param_estimates[[2]] <- matrix(nrow=n_sims,ncol=2)
param_estimates[[3]] <- matrix(nrow=n_sims,ncol=3)
param_estimates[[4]] <- matrix(nrow=n_sims,ncol=4)

for ( ii in 1:n_sims ) {
    set.seed(ii)    # for reproducibility
    xx <- runif(n_sample,0,1)
    yy <- xx^2+rnorm(n_sample)
    param_estimates[[1]][ii,] <- summary(lm(yy~xx))$coefficients[,1]
	param_estimates[[2]][ii,] <- summary(lm(yy~I(xx^2)))$coefficients[,1]
    param_estimates[[3]][ii,] <- summary(lm(yy~xx+I(xx^2)))$coefficients[,1]
	param_estimates[[4]][ii,] <- summary(lm(yy~xx+I(xx^2)+I(xx^3)))$coefficients[,1]
}

beeswarm_matrix <- function(MM, amount=0.3, add.boxplot=FALSE, add.beanplot=FALSE, names=NULL, pt.col=NULL, ...) {  
    # beeswarm plots of matrix columns
    plot(c(1-2*amount,ncol(MM)+2*amount),range(MM,na.rm=TRUE),xaxt="n",type="n",...)
    axis(1,at=1:ncol(MM),labels=if(is.null(names)){colnames(MM)}else{names},...)
    if ( add.boxplot ) boxplot(MM, add=TRUE, xaxt="n", outline=FALSE, border="grey", ...)
    if ( add.beanplot ) {
        require(beanplot)
        sapply(1:ncol(MM),function(xx)beanplot(MM[,xx],add=TRUE,what=c(0,1,1,0),xaxt="n",
            col=c(rep("lightgray",3),"lightgray"),border=NA, at=xx,...))
    }
    pt.col.mat <- matrix(if(is.null(pt.col)){"black"}else{pt.col},nrow=nrow(MM),ncol=ncol(MM),byrow=TRUE)
    points(jitter(matrix(1:ncol(MM),nrow=nrow(MM),ncol=ncol(MM),byrow=TRUE),amount=amount),MM,col=pt.col.mat,...)
}

opar <- par(las=1,mfrow=c(2,2),mai=c(.5,.5,.1,.1),pch=19)
    beeswarm_matrix(param_estimates[[1]],add.beanplot=TRUE,xlab="",ylab="",cex=0.5,
        names=c("Intercept",expression(x)))
    beeswarm_matrix(param_estimates[[2]],add.beanplot=TRUE,xlab="",ylab="",cex=0.5,
        names=c("Intercept",expression(x^2)))
    beeswarm_matrix(param_estimates[[3]],add.beanplot=TRUE,xlab="",ylab="",cex=0.5,
        names=c("Intercept",expression(x),expression(x^2)))
    beeswarm_matrix(param_estimates[[4]],add.beanplot=TRUE,xlab="",ylab="",cex=0.5,
        names=c("Intercept",expression(x),expression(x^2),expression(x^3)))
par(opar)
$\endgroup$
1
  • 2
    $\begingroup$ Thanks a lot for this answer. Really liked the "parameter estimates are random variables" part the most, which is not emphasized in other answers about the bias-variance decomposition. $\endgroup$
    – mhdadk
    Commented May 6, 2021 at 12:20
5
$\begingroup$

Informally

  • Bias is how far away on average your estimator is from the true value. "On average" hides the point that in practice you are only going to make one estimate, which could be a long way away from the true value even if the bias is low. Your how far your model parameters are from true parameters is not a reasonable description of this as it misses the average point

  • Variance is a measure of (the square of) the dispersion of your estimator from its average. Again this hides the point that you are going to make a single estimate. It also ignores errors from a high bias. So your how well it generalizes to new instances is not a reasonable description of this either, as it misses the point that it measures dispersion from the wrong figure

You do not want either or both of these to be high, as that could cast doubt on the value of any estimate. You can combine them: the variance plus the square of the bias gives the expected mean-square error, so taking the square-root of that sum gives a measure of the scale of the potential error of a single use of your estimator from the true value.

$\endgroup$
2
  • $\begingroup$ Ok, I got my mistake for "average" in bias but didn't understand your point for variance. According to my understanding, Variance or standard error measures how we would expect the estimator we compute from data to vary as we independently resample the dataset from the underlying data generative process. So where am I wrong in the definition? $\endgroup$ Commented May 5, 2021 at 13:55
  • $\begingroup$ @GopalBhattrai what you say is not wrong in itself, but variance is measured from the expected value of the estimator, not from the true value (which will be different if there is any bias) $\endgroup$
    – Henry
    Commented May 5, 2021 at 14:20
3
$\begingroup$

Suppose that have a machine which cuts wooden planks.
The goal is to have each plank be 4 meters long.
Suppose that a machine cuts at least a dozen such wooden planks.
You now measure the lengths of the wooden boards.


BIAS

"The machine has a "high degree of bias" means that the boards are always too long or always too short.
If the wood cutting machine has "low degree of bias" means that boards are cut too long half of the time and cut too long half of the time.

VARIANCE

A wood cutting machine has "high variance" if the wooden planks are almost never the same length. One of the boards was 3.2 meters long, and another board is 5.14 meters long.
A wood cutting machine has a "low degree of variance" if the the wooden planks are usually the same length as the other boards.

COMBINATIONS OF VARIANCE AND BIAS

LOW VARIANCE HIGH VARIANCE
LOW BIAS the boards are almost perfect the boards are all different sizes, but the average board length is correct
HIGH BIAS all of the boards are exactly 6 meters long instead of the desired 4 meters the boards are all difference sizes and the average length is nowhere near 4 meters either
$\endgroup$
1
$\begingroup$

[Bias] simply represents how far your model parameters are from true parameters of the underlying population.

That is incorrect and very badly written.

Bias is the difference between the true value of a parameter and the average value of an estimate of the parameter.

Represents how good it generalizes to new instances from the same population.

That's even worse. Variance is the average of the square of the difference between an estimator and the average value of the estimator.

$\endgroup$
4
  • 1
    $\begingroup$ Is the second quote meant for variance? I am asking because variance was not defined this way by the OP. $\endgroup$ Commented May 6, 2021 at 11:46
  • 2
    $\begingroup$ It's probably not very polite to tell someone what they wrote is badly written or "worse". That's generally too vague to be constructive, so it ends up just being an insult. If this were quoted from elsewhere, it might arguably be more useful, as it could indicate one shouldn't trust that source, but this doesn't seem to apply here (of course someone who admits being new to ML won't be a trusted source on ML knowledge). The asker's incorrect quotes also probably won't be useful to anyone seeing this answer, aside from the asker, but I digress. $\endgroup$ Commented May 6, 2021 at 14:04
  • $\begingroup$ @RichardHardy : The second quote is verbatim from the original posting, and it is indeed how it was defined by the original poster. (That was altered in a later edit.) $\endgroup$ Commented May 6, 2021 at 15:19
  • 1
    $\begingroup$ @MichaelHardy, I cannot see this in the history of the question. But that is not that important anyway. $\endgroup$ Commented May 6, 2021 at 16:15

Your Answer

By clicking “Post Your Answer”, you agree to our terms of service and acknowledge you have read our privacy policy.

Not the answer you're looking for? Browse other questions tagged or ask your own question.