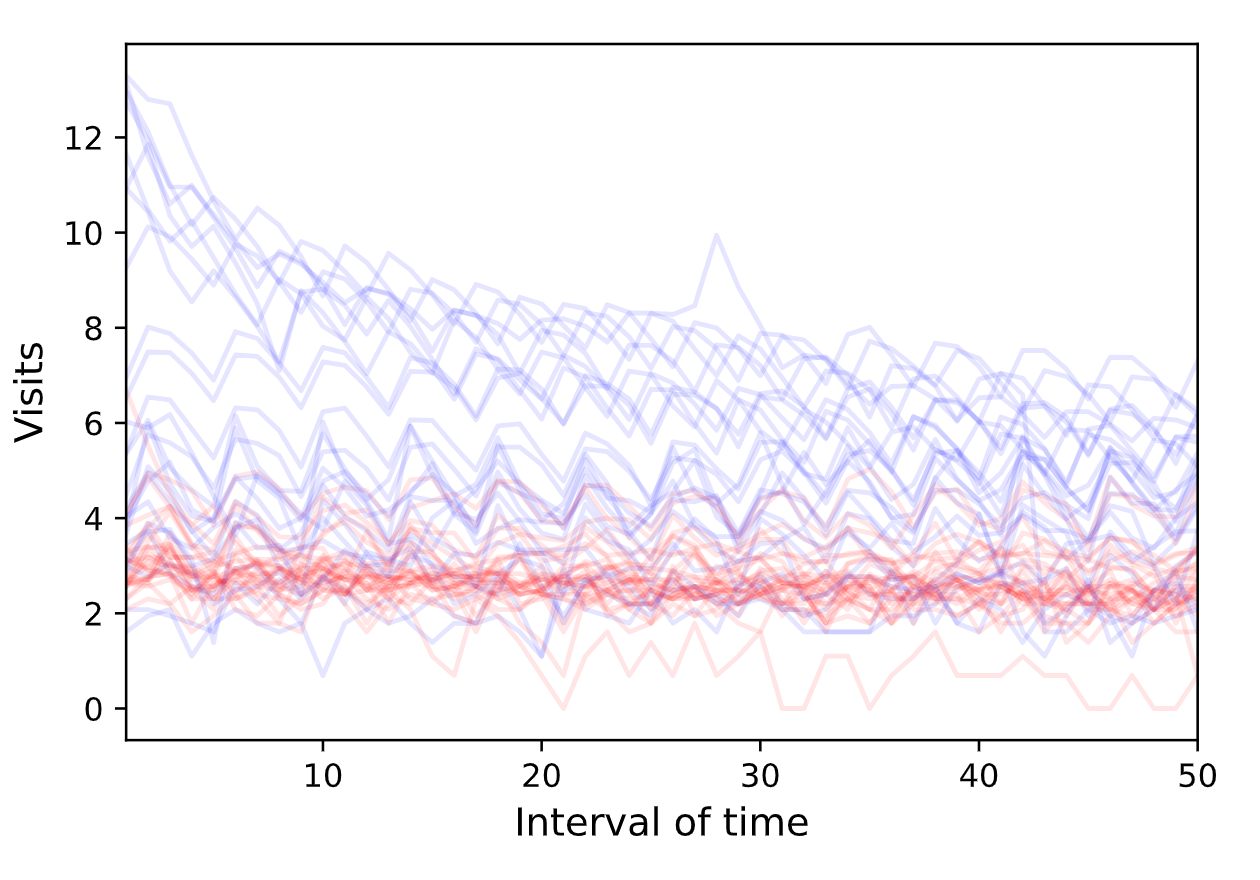
I'm working on a dataset of all visits generated by email campaigns that were sent in 2020, and the goal is to develop a clustering model that groups similar campaigns (trend line similarity) together with the hope that I can forecast future email campaigns that may have similar trend behavior.
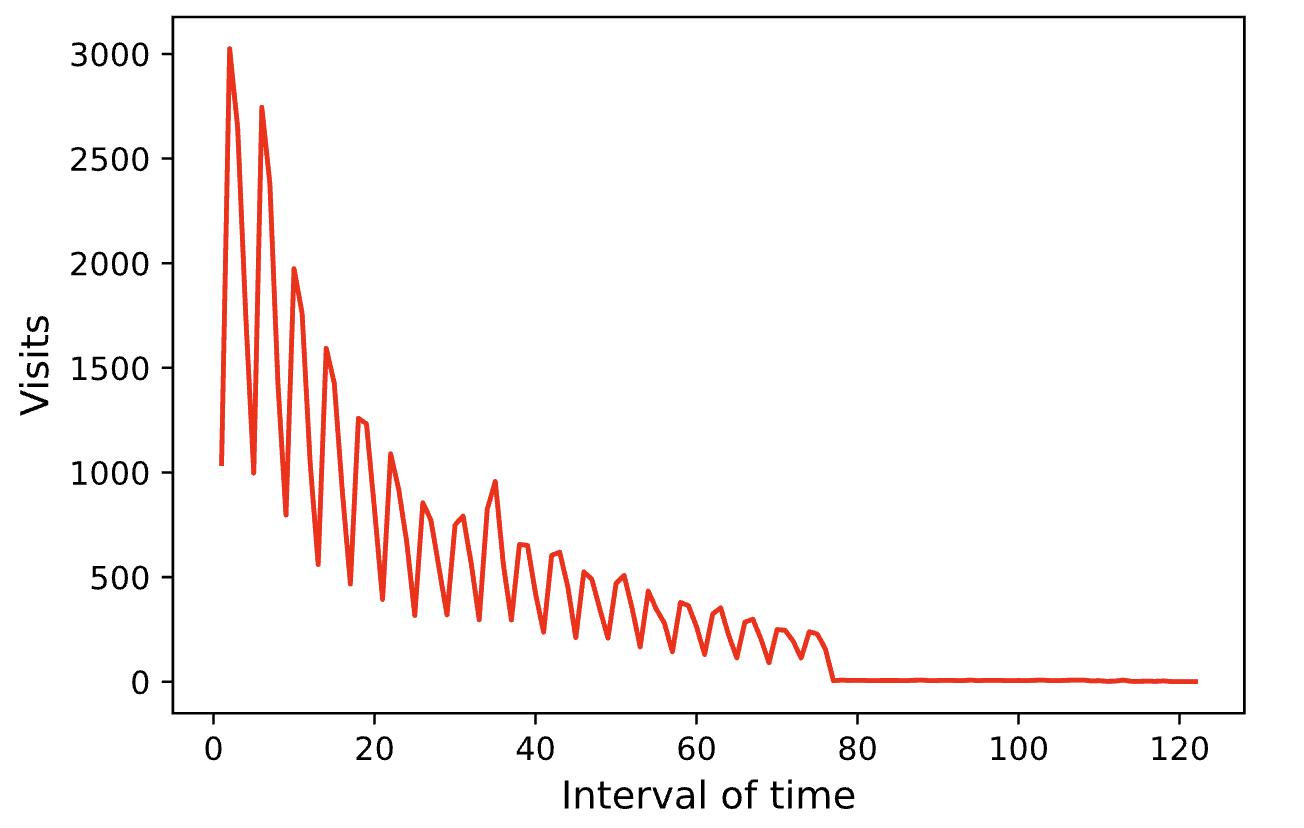
All visits from email campaign are right-skewed data that require log transformation. Below is an example of how the trends look like without the transformation.
The time interval I'm using is X hours of time. If X = 6, then interval 1 is the first 6 hour, interval 2 is the second 6 hour (or 12 hour mark), etc. The challenge is that different email campaigns have different intervals of time (unequal length). For example, Campaign 1 may run for 10 time intervals, Campaign 2 for 26 time intervals, and so on.
My interpolation process has involved finding the longest running campaign, and then expanding shorter campaigns by adding zeroes to the dataset (i.e. no visits). This helps me create equal lengths for each campaign, and allow me to feed my data to a DBSCAN clustering model.
[
 [x_1,x_2,x_3,...,0],
 [y_1,y_2,y_3,...,0],
 [z_1,z_2,z_3,...,0],
]
I used a custom metric (fastDTW) to measure distance of each campaign trend:
cluster_dbscan = DBSCAN(eps=100, min_samples=10, metric=udf_dtw, metric_params={'radius':9}).fit(X)
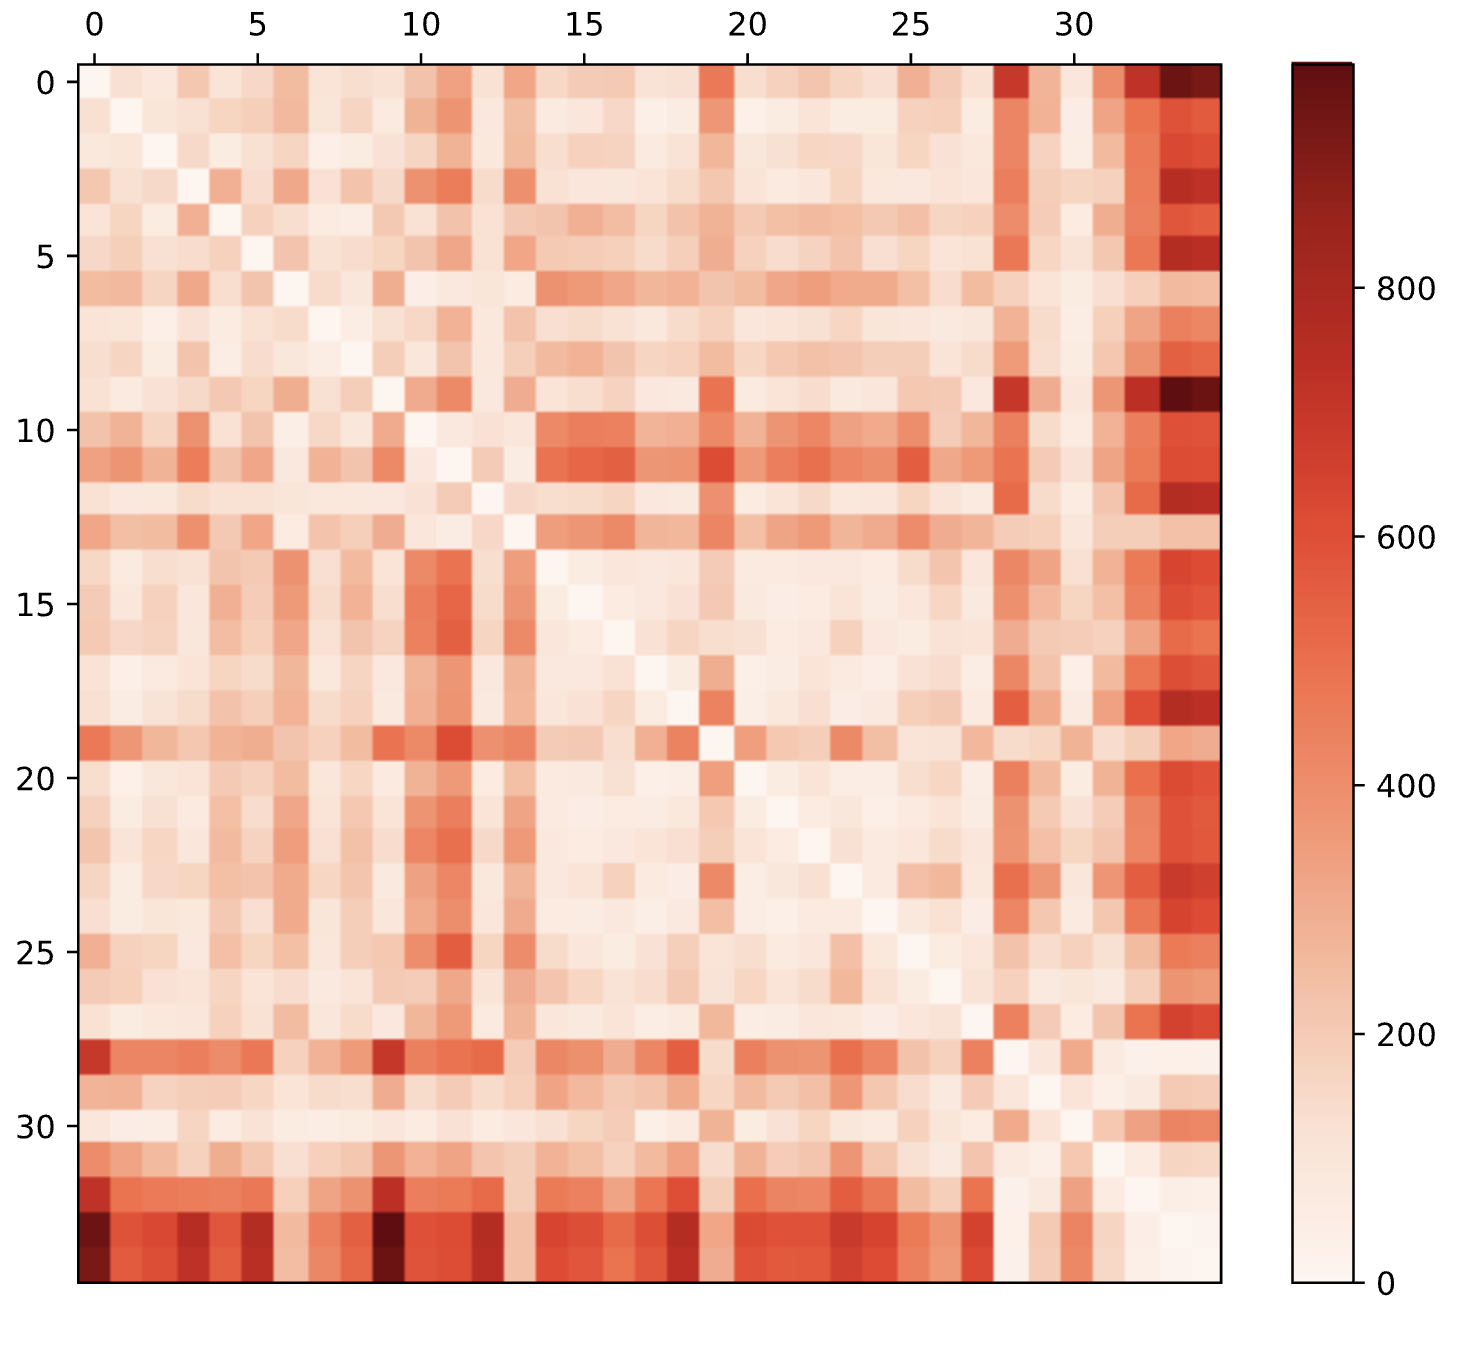
The EPS value is based on my review of the dataset by examining the cross DTW value of the campaigns, where values closer to 0 represents equal similarity of email campaign visit trends (imshow output below).
Running the DBSCAN has been fruitless so far; the results are interpreted as either 0 or -1 (noise). Changing the parameters didn't bring me much success either. Visually, I can see there are some trend lines that are similar, but it seems the clustering model is not recognizing them.
Note: The visits are log transformed, which is also the data being fed to DBSCAN

What am I missing in terms of how I'm approaching this problem?
- Is DBSCAN a good clustering tool for such a project?
- Is my interpolation technique valid? I worry that adding zeroes may impact DTW calculations, but without the padding, I cannot run DBSCAN if that's a good clustering tool to use (I receive the error
float() argument must be a string or a number, not 'list')


